PMM (Percona Monitoring and Management) is a great community tool for monitoring your OSDB (MySQL, PostgreSQL, MongoDB) fleet. It's feature rich, and it's built and distributed as open-source based on several de-facto industry standard tools such as Grafana and Prometheus. In the second half of last year, major version 2 was released and whereas the major components remained mostly the same, some significant architectural changes were made, but this is out-of-scope for this post.
Upgrading to PMM2 is basically the same as starting from scratch with a fresh install; it requires re-adding all your servers, which can be a painful process if you have a large fleet of instances. For servers where you have OS level access, you can just install the PMM2 agent, but for RDS there is no access to the OS so another approach is required. In this blog, I will focus on getting a large number of RDS instances added.
 On the far right side of the screen, you have a "PMM" menu, and in that menu, you have a "PMM Add Instance" option. This option can be used to add instances to be monitored remotely, for example when you don't have OS level access to install the agent, or if you are not allowed to install an agent on the targeted machine. However, if neither of these constraints are in place I would recommend adding the server to PMM in the usual way by installing the agent. Without the agent, you will not be able to monitor OS level metrics, because you simply have no visibility into them remotely.
When you click the "PMM Add Instance" menu you get access to a second menu where you can choose your type of instance to add.
On the far right side of the screen, you have a "PMM" menu, and in that menu, you have a "PMM Add Instance" option. This option can be used to add instances to be monitored remotely, for example when you don't have OS level access to install the agent, or if you are not allowed to install an agent on the targeted machine. However, if neither of these constraints are in place I would recommend adding the server to PMM in the usual way by installing the agent. Without the agent, you will not be able to monitor OS level metrics, because you simply have no visibility into them remotely.
When you click the "PMM Add Instance" menu you get access to a second menu where you can choose your type of instance to add.
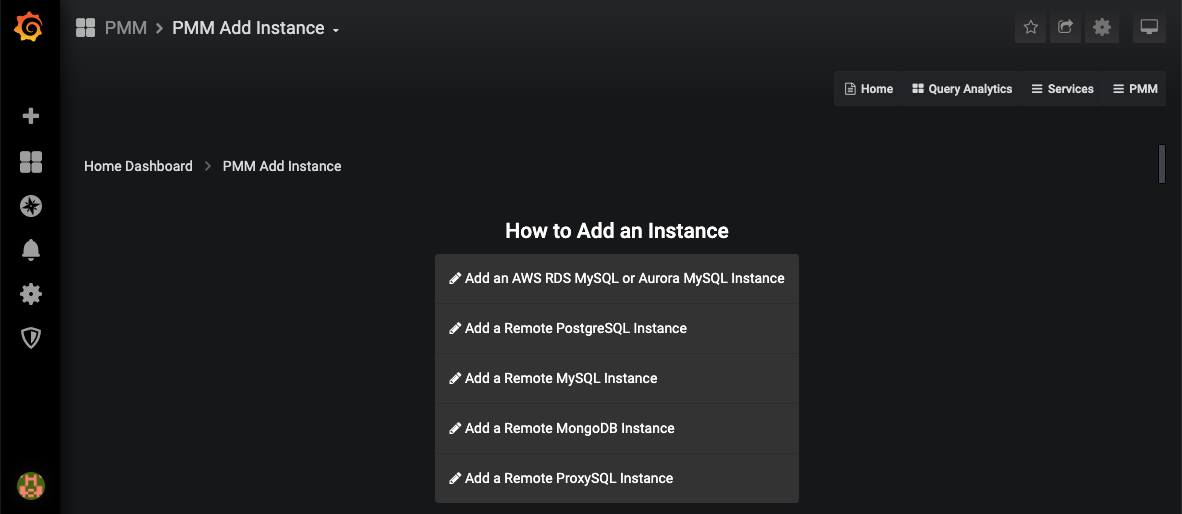 In this post, we will be using the first option "Add an AWS RDS MySQL or Aurora MySQL instance." As mentioned before, the other options are there for your convenience, but use them wisely, as they will not provide you OS level metrics such as CPU usage, memory consumption, and disk-related stats. Let's move on and click on the Add RDS option.
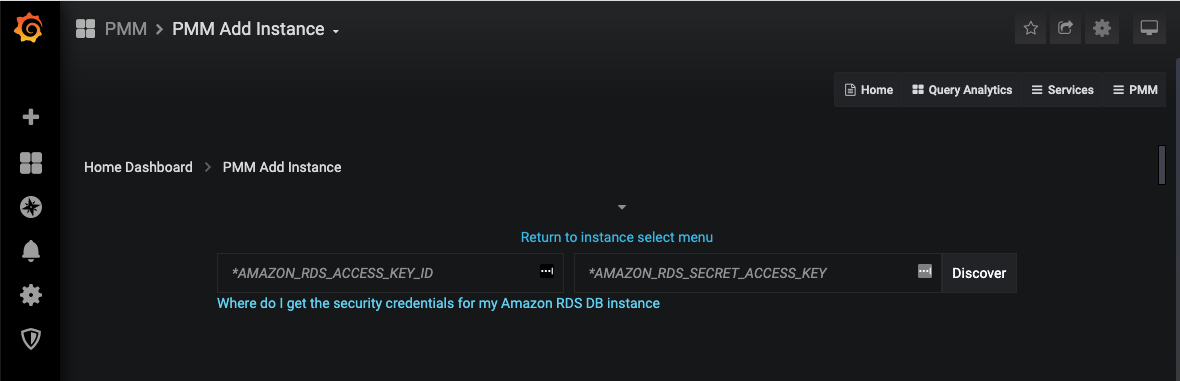 Now PMM asks for an AWS access key and secret to discover the instances. Note: the documentation says that an IAM-role should also work, however, I have not tried that option at this time. Let's provide the credentials and continue.
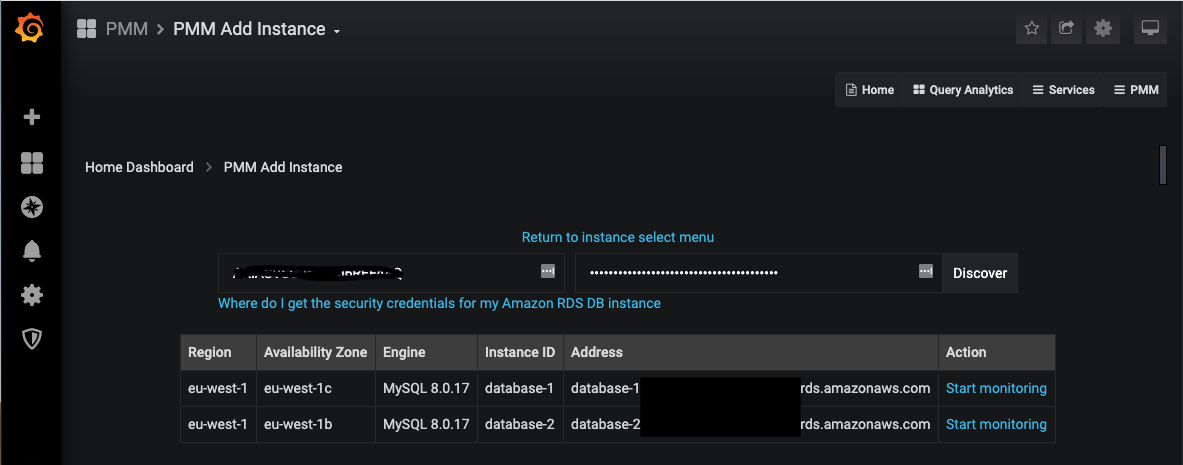 In this test account on AWS, I have two instances created; database-1 is the master, and database-2 is the read-replica. If I click the "Start monitoring" link for database-1 it shows me another input form asking me to provide details to connect to the instance such as username and password, TLS config, some extra labels which will be useful in the Grafana interface, etc. Fill out that form to the best of your abilities. If you have trouble doing so, leave a comment on this blog and I will follow this up with a more detailed blog about these settings.
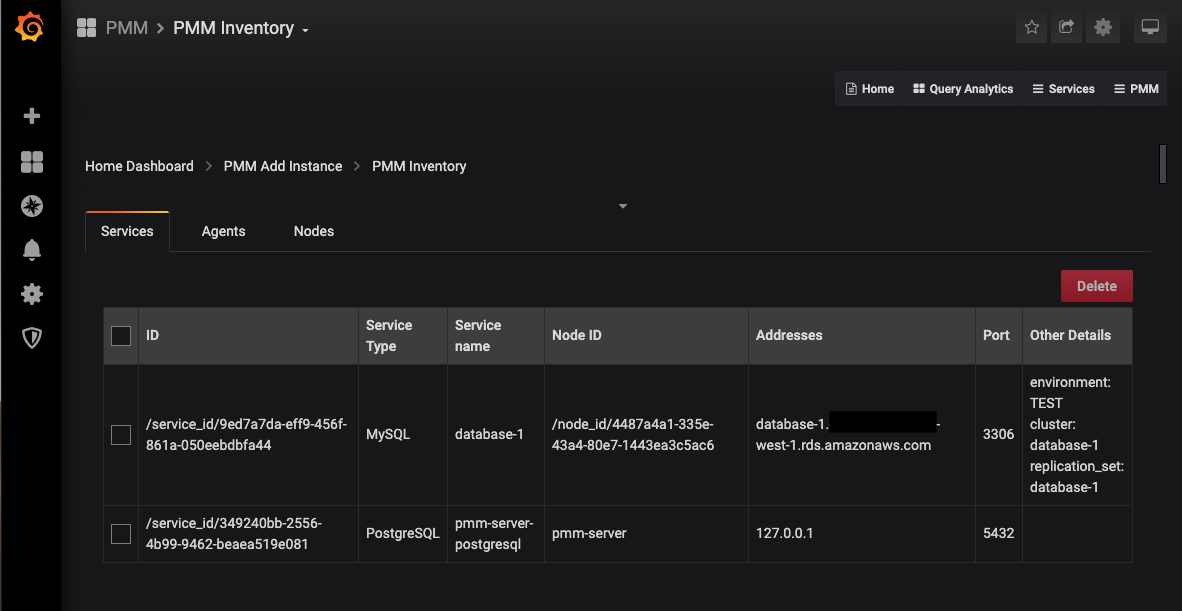
If all goes well, you'll end up in the "PMM Inventory" page and it will show your newly added instance.
In this test account on AWS, I have two instances created; database-1 is the master, and database-2 is the read-replica. If I click the "Start monitoring" link for database-1 it shows me another input form asking me to provide details to connect to the instance such as username and password, TLS config, some extra labels which will be useful in the Grafana interface, etc. Fill out that form to the best of your abilities. If you have trouble doing so, leave a comment on this blog and I will follow this up with a more detailed blog about these settings.
If all goes well, you'll end up in the "PMM Inventory" page and it will show your newly added instance.
 Success! But, if you have tens or hundreds of RDS instances to add ... good luck ... Time for some scripting/automation.
 If you want to use the Swagger UI to test the API you have to keep two things in mind:
 If you scroll down a little in the Swagger interface you will also see a specific RDS section:
 I expect these endpoints to be an all-in-one solution (they're probably also the call the UI will be using), but I have decided not to use them because I wanted my script to be a little more robust. I also don't want the script to attempt to create a new instance on every iteration.
Adding RDS instances manually
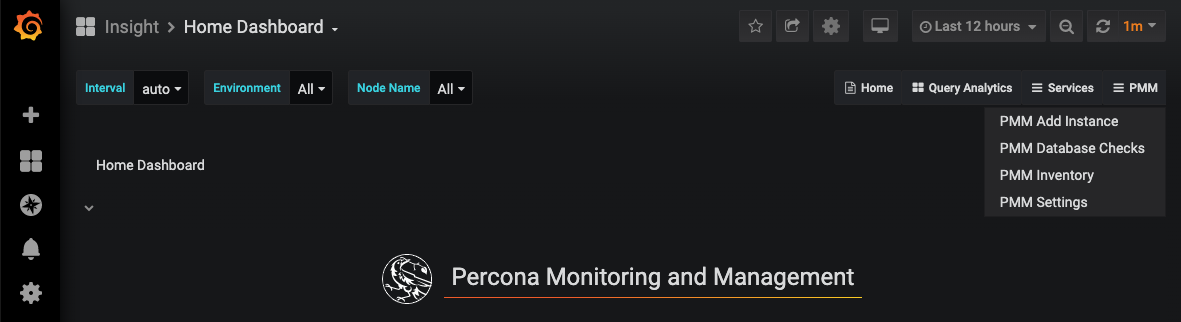
First, I will describe the manual process needed to add RDS instances to PMM. My starting point is the PMM Home dashboard.
On the far right side of the screen, you have a "PMM" menu, and in that menu, you have a "PMM Add Instance" option. This option can be used to add instances to be monitored remotely, for example when you don't have OS level access to install the agent, or if you are not allowed to install an agent on the targeted machine. However, if neither of these constraints are in place I would recommend adding the server to PMM in the usual way by installing the agent. Without the agent, you will not be able to monitor OS level metrics, because you simply have no visibility into them remotely.
When you click the "PMM Add Instance" menu you get access to a second menu where you can choose your type of instance to add.
In this post, we will be using the first option "Add an AWS RDS MySQL or Aurora MySQL instance." As mentioned before, the other options are there for your convenience, but use them wisely, as they will not provide you OS level metrics such as CPU usage, memory consumption, and disk-related stats. Let's move on and click on the Add RDS option.
Now PMM asks for an AWS access key and secret to discover the instances. Note: the documentation says that an IAM-role should also work, however, I have not tried that option at this time. Let's provide the credentials and continue.
In this test account on AWS, I have two instances created; database-1 is the master, and database-2 is the read-replica. If I click the "Start monitoring" link for database-1 it shows me another input form asking me to provide details to connect to the instance such as username and password, TLS config, some extra labels which will be useful in the Grafana interface, etc. Fill out that form to the best of your abilities. If you have trouble doing so, leave a comment on this blog and I will follow this up with a more detailed blog about these settings.
If all goes well, you'll end up in the "PMM Inventory" page and it will show your newly added instance.
Success! But, if you have tens or hundreds of RDS instances to add ... good luck ... Time for some scripting/automation.
PMM API to the rescue
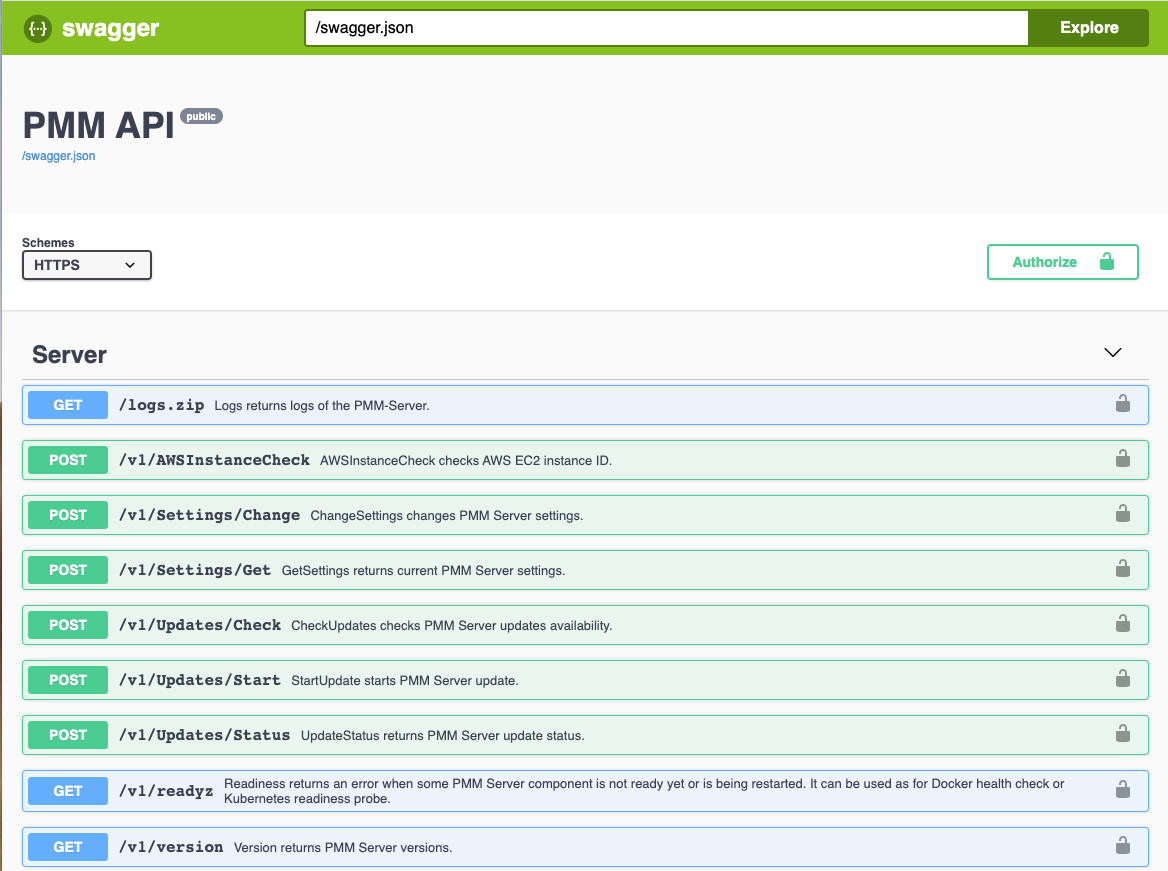
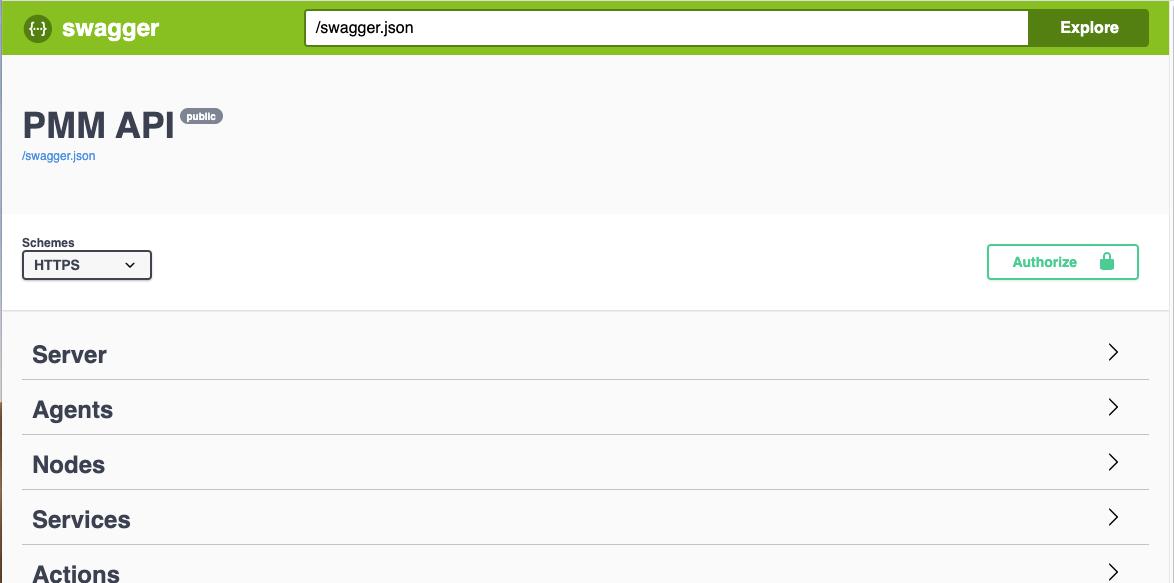
Just like many other modern software tools, PMM comes with an API that you can use to automate everything I've shown up until now. Percona uses Swagger for its API documentation. Swagger also provides an interface for exploring and testing the API. The swagger documentation for PMM is deployed with each installation and you access it on the /swagger/ endpoint on your server (full URL reference http(s)://your.pmm.server/swagger/). The screenshot below shows what you should see on that endpoint. If you're getting a white screen, make sure that you have added the trailing / to the URL.
If you want to use the Swagger UI to test the API you have to keep two things in mind:
- Select the proper scheme (HTTP or HTTPS) for your server in the select box on the left.
- Authorize yourself using the button on the right. The API uses basic authorization via the request-headers and it utilizes the Grafana users you have created for accessing the Grafana component of PMM.
Exploring the API
As the "PMM Inventory" screenshot has already hinted, PMM uses three concepts in its configuration: services, agents and nodes. You will also see those concepts in the API.
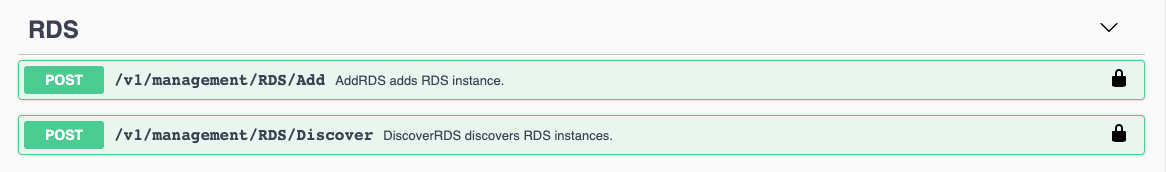
If you scroll down a little in the Swagger interface you will also see a specific RDS section:
I expect these endpoints to be an all-in-one solution (they're probably also the call the UI will be using), but I have decided not to use them because I wanted my script to be a little more robust. I also don't want the script to attempt to create a new instance on every iteration.
Scripting against the API
For this particular task, I decided to try and keep dependencies very low and I wrote my script in bash. The only dependencies are:awsclifor being able to crawl the RDS instancescurlfor making API calls to PMMjqfor manipulating JSON objects
# PMM details
 PMM_API_ENDPOINT='http(s)://<address of PMM>/v1/inventory'
 PMM_API_AUTHORIZATION='Basic <base64 encoding of user:password for PMM>'

 # Execute an API call to PMM
 # This function requires 2 params:
 # 1. API_METHOD: Api endpoint
 # 2. API_PAYLOAD: JSON payload for the call
 function pmm_api_call() {
  PMM_API_METHOD=${1}
  PMM_API_PAYLOAD=${2}

  [[ -z ${PMM_API_METHOD} ]] && echo "[pmm_api_call] no PMM_API_METHOD defined" && return -1
  [[ -z ${PMM_API_PAYLOAD} ]] && echo "[pmm_api_call] no PMM_API_PAYLOAD defined" && return -1

  echo $(${CURL} --silent -X POST "${PMM_API_ENDPOINT}/${PMM_API_METHOD}" \
  -H "accept: application/json" \
  -H "authorization: ${PMM_API_AUTHORIZATION}" \
  -H "Content-Type: application/json" \
  -d "$(echo ${PMM_API_PAYLOAD} | jq -rc)")
  return 0
 }
The script queries the AWS API, loops through the available instances, and will check the output for the
Nodes/List
endpoint to see if the node already exists in PMM. If not it calls the
Nodes/AddRemoteRDS
endpoint to create the node. Once we have a node in PMM we can create a service using the
Services/AddMySQL
endpoint.
We should now have a
node_id
(to identify the node) and a
service_id
(to identify the service) but no data is being collected yet. The actual data is being collected by the agents. And in PMM an agent usually translates into processes collecting data (such as a
mysqld_exporter
for MySQL metrics or an
rds_exporter
for CloudWatch metrics through the AWS APIs).
PMM handles these exporter processes for RDS instances by running them on the PMM server machine. Obviously, RDS does not allow for OS level access for running an agent on the machine. So collecting data in this way is not an option. Running the exporters locally on the PMM-server is a convenient way to work around this, however, this is not a requirement. If you have hundreds of instances to monitor you will easily overload your PMM-server with all those exporter processes. The web-interface does not give you the option to direct the PMM agent to run the collector but since we're using the API, the choice is yours. Prepare for this by installing the PMM2 agent on the machine you provision for this purpose following the
documentation
. Once you have it ready, run the following command (or get this information using the API):
$ sudo pmm-admin list
 Service type Service name Address and port Service ID

 Agent type Status Agent ID Service ID
 pmm_agent Connected /agent_id/a8b04c77-068c-41ab-a8ff-ab5ff4138750
 node_exporter Running /agent_id/22a969a5-6047-4c29-b801-f71a6b448151
From this output, you need to grab the Agent ID for the PMM agent. In the API calls to create the agents, there is a field
pmm_agent_id
. By default, you would specify the "hardcoded" id
pmm-server
to run the specific exporter on the PMM Server. If you want to relocate the exporter to this new machine, you provide the Agent ID collected from the output of the command above. You can verify this by running the same command again, which will show you the exporters running on the secondary machine.
$ sudo pmm-admin list
 Service type Service name Address and port Service ID

 Agent type Status Agent ID Service ID
 pmm_agent Connected /agent_id/a8b04c77-068c-41ab-a8ff-ab5ff4138750
 node_exporter Running /agent_id/22a969a5-6047-4c29-b801-f71a6b448151
 mysqld_exporter Running /agent_id/a89f6668-594f-47d5-b52e-a7e95e8e837d /service_id/ac30b140-36d8-44c6-9e30-9934c047005b
 mysqld_exporter Running /agent_id/aca98113-df84-4616-9255-16a81e727ad6 /service_id/9ed7a7da-eff9-456f-861a-050eebdbfa44
 rds_exporter Running /agent_id/41a55bca-6860-4609-b5dd-8faeb66ec114
 rds_exporter Running /agent_id/c1dd57f3-0167-4b0a-98ce-b7536110870a

