Amazon Elasticsearch Service is a managed service to implement Elasticsearch in AWS. Underlying instances are managed by AWS and interaction with the service is available through API and AWS GUI. Kibana is also integrated with Amazon Elasticsearch Service. We came across an issue which caused Kibana4 to show the following error message, when searching for *.
 We checked "_msearch?timeout=3000.." and received following errors messages under the nested values (For example "responses" -> "0" -> "_shards" -> "failures" -> "0")
Courier Fetch: 10 of 60 shards failed.
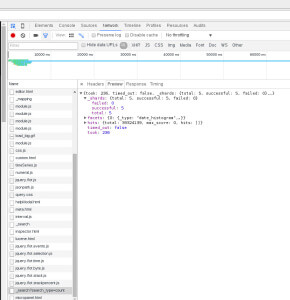
Error is not very descriptive. As Amazon Elasticsearch service is an endpoint only and we do not have direct access to the instances. We also have access to few API tools. We decided to see what can be found from the chrome browser. The Chrome Developer Tools (DevTools) contains lots of useful debugging possibilities. DevTools can be started using several methods. 1. Right click and click Inspect. 2. From Menu -> More Tools -> Developer Tools 3. Press F12 Network tab under DevTools can be used to debug wide variety of issues. It records every requests made when a web page is loading. It captures wide range of information about every request like HTTP access Method, status and time took to complete the request etc. By clicking on any of the requested resource, we will be able to get more information on the request. In this case, the interesting bit was under the Preview tab. The Preview tab captures the data chrome got back from the search and store it as objects. A successful query would look like the image below captured from Kibana3 of public website logstash.openstack.org.
We checked "_msearch?timeout=3000.." and received following errors messages under the nested values (For example "responses" -> "0" -> "_shards" -> "failures" -> "0")
{index: "logstash-2016.02.24", shard: 1, status: 500,…}index: "logstash-2016.02.24"reason: "RemoteTransportException[[Leech][inet[/10.212.25.251:9300]][indices:data/read/search[phase/query]]]; nested: ElasticsearchException[org.elasticsearch.common.breaker.CircuitBreakingException: [FIELDDATA] Data too large, data for [@timestamp] would be larger than limit of [5143501209/4.7gb]]; nested: UncheckedExecutionException[org.elasticsearch.common.breaker.CircuitBreakingException: [FIELDDATA] Data too large, data for [@timestamp] would be larger than limit of [5143501209/4.7gb]]; nested: CircuitBreakingException[[FIELDDATA] Data too large, data for [@timestamp] would be larger than limit of [5143501209/4.7gb]]; "shard: 1status: 500
So the issue is clear, fielddata usage is above the limit. As per
Amazon documentation,
Field Data Breaker - Percentage of JVM heap memory allowed to load a single data field into memory. The default value is 60%. We recommend raising this limit if you are uploading data with large fields. indices.breaker.fielddata.limit For more information, see
Field data in the Elasticsearch documentation.
Following url documents the supported Amazon Elasticsearch operations.
https://docs.aws.amazon.com/elasticsearch-service/latest/developerguide/es-gsg-supported-operations.html On checking the current heap usage (second column) of the data nodes, we can see that heap usage is very high,
$ curl -XGET "https://elasticsearch.abc.com/_cat/nodes?v" host ip heap.percent ram.percent load node.role master name x.x.x.x
10 85 0.00 - m Drax the Destroyer x.x.x.x
7 85 0.00 - * H.E.R.B.I.E. x.x.x.x
78 64 1.08 d - Black Cat x.x.x.x
80 62 1.41 d - Leech x.x.x.x
7 85 0.00 - m Alex x.x.x.x
78 63 0.27 d - Saint Anna x.x.x.x
80 63 0.28 d - Martinex x.x.x.x
78 63 0.59 d - Scorpio
Following command can be used to increase the indices.breaker.fielddata.limit value. This can be used as a workaround.
$ curl -XPUT elasticsearch.abc.com/_cluster/settings -d '{ "persistent" : { "indices.breaker.fielddata.limit" : "89%" } }'
Running the command allowed the kibana search to run without issues and show the data. The real solution would be to increase the number of nodes or reduce the amount of field data that need to be loaded by limiting number of indexes.
AWS Lamda can be used to to run a script to cleanup indices as a
scheduled event.