Microsoft Build 2018 recently wrapped up and it was an exciting three days of big announcements for many of Microsoft’s services. One small feature update which caught my eye is the revamped
Azure Monitor container
health service which rolled out to the public as a preview on May 7th, 2018. If this feature sounds familiar, you are right. Azure Monitor container health is based on pre-existing resources like Azure Monitor, Azure Log Analytics and the Container Insights solution which are integrated into the AKS cluster deployment.
This article is a how-to/walk-through on deploying Azure Kubernetes cluster with the new Azure Container health monitoring service.
Before I go into more detail, I would like to highlight a few key things. We all know how useful Azure Log Analytics can be. Azure Log Analytics is a service in the Microsoft Operations Management Suite (OMS) that helps us collect and analyze data generated from various Azure cloud services and on-premise environments. Azure Kubernetes Service makes use of a containerized version of OMS to provide log, health and key performance metrics for an AKS cluster and its pods.
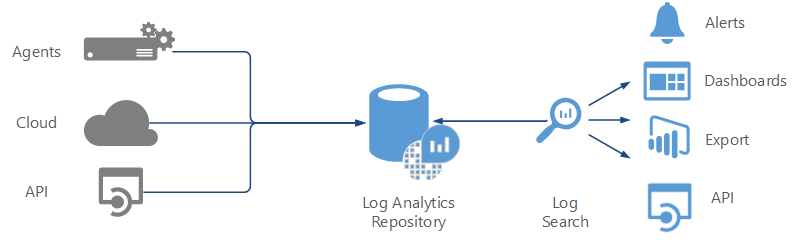 We should also be aware that all the logs metrics from the container are sent to a central Log Analytics repository (workspace) for further log analysis. Until recently, understanding an Azure Kubernetes cluster environment required manually integrating a few different solutions like a Log Analytics workspace and a container monitoring solution to get deeper insights into containers. Users can now use this new Kubernetes service with monitoring enabled to analyze logs, performance bottlenecks, system interactions and debug failures from a single dashboard in the Azure portal.
How awesome is that? Azure has listened to its partners and eliminated the extra work needed to monitor an AKS cluster. So let's get started.
We should also be aware that all the logs metrics from the container are sent to a central Log Analytics repository (workspace) for further log analysis. Until recently, understanding an Azure Kubernetes cluster environment required manually integrating a few different solutions like a Log Analytics workspace and a container monitoring solution to get deeper insights into containers. Users can now use this new Kubernetes service with monitoring enabled to analyze logs, performance bottlenecks, system interactions and debug failures from a single dashboard in the Azure portal.
How awesome is that? Azure has listened to its partners and eliminated the extra work needed to monitor an AKS cluster. So let's get started.
Deploying the AKS cluster
Make sure you have an active Microsoft Azure subscription or create a new account with Azure , which comes with $200 USD worth of Azure credits. Azure Container monitoring service supports versions 1.7.7 through 1.9.6 of AKS cluster.- Create a new resource for Kubernetes service. In Azure portal create a new resource -> Containers -> Kubernetes service.
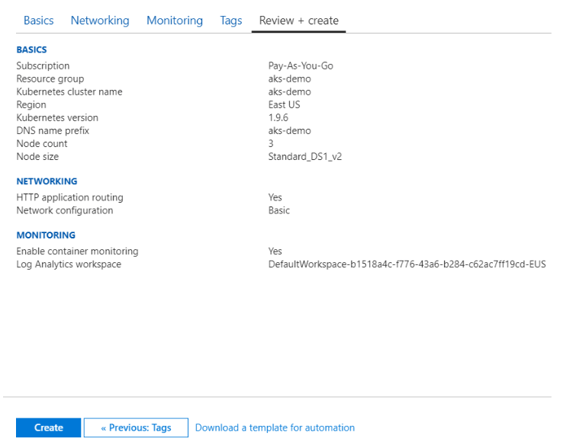
- Enter the resource group name, cluster name, node size and other basic configurations as required for the cluster, as shown below. For this demo we have:
- Standard DS1 v2 (1 VCPUs, 3.5 GB memory)
- Three nodes along with the cluster (we can later resize the cluster if required)
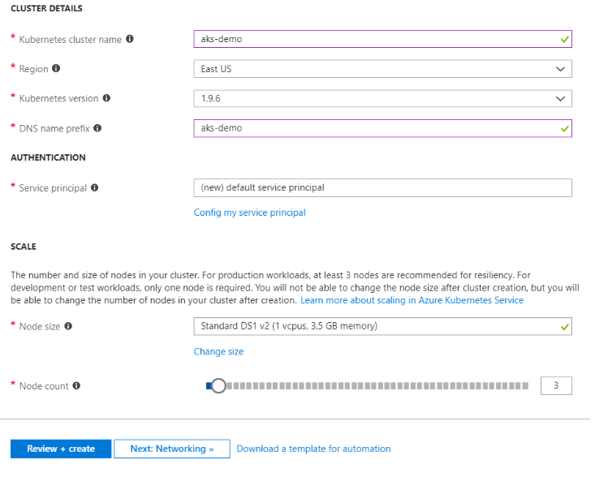
- Once you review the cluster details, click “Next: Networking” for configuring the network settings. To keep this clean and simple, I am going to choose the network configuration “basic”. This creates a VNET for our AKS cluster using default values.
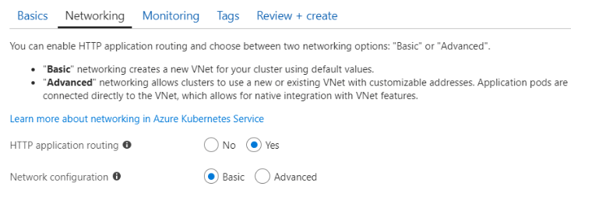
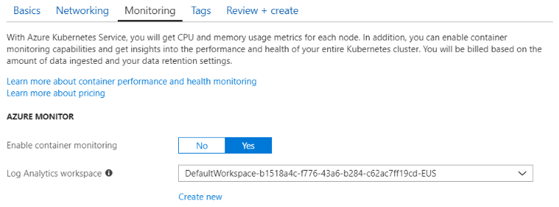
- We can see that there is a new tab titled “Monitoring”. This is where we enable Azure container monitoring options. Select Yes for enabling the monitoring service. By default, it creates a new log analytics workspace or you can also choose a pre-existing one.
- Add any tags if you require resources to have certain labels so that you can query them by label selector. Finally, review the configuration for the AKS cluster and deploy it.
- The deployment can take up to 20 minutes. You can use the Azure portal to monitor the deployment. Navigate to the newly created resource group, select Deployments > Overview to see the status of the deployed resources.
Working with AKS cluster
-
- Connect to AKS cluster using Azure CLI on your desktop or simply use Azure Cloud shell on the Azure portal. We are using Azure Cloud shell for this demo since it comes with the pre-installed kubectl client.
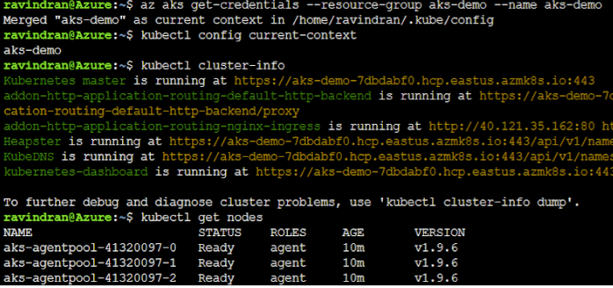
- Configure kubectl to connect to our new cluster using the following command az aks get-credentials --resource-group aks-demo --name aks-demo
- Check your kubectl if it is properly configured to the right AKS cluster using kubectl config current-context command.
- Let's try to get some more info on the cluster using kubectl cluster-info
- Use the kubectl get nodes command to retrieve the nodes in the cluster.
Deploying a sample application on AKS
We are going to use a sample word builder application shown at DockerCon EU 2017 for this demo. This application runs across three containers:- A Postgres database which stores words
- Java REST API which serves words read from the database
- A web application is written in Go which calls the above API and builds words into sentences
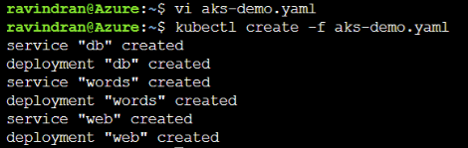
- To deploy our container applications, create a new file named aks-demo.yaml using vi or Nano editor in Azure cloud shell. Copy the above YAML code into aks-demo.yaml
- In the above manifest file, we have three Kubernetes deployments and three Kubernetes services to successfully run the word builder application. Only the web application container is publicly exposed to the internet with an external IP. Use the kubectl create command to deploy the application on the cluster.
- Use the kubectl create command to deploy the application on the cluster kubectl create -f aks-demo.yaml
- This creates a complete deployment of our application and exposes the front-end application on port 8081. Use kubectl get pods to see which pods are running after the deployment.
- We can also see the current STATUS column of each container which is provisioned inside the pods. We can see that all of our containers are in a Running state.
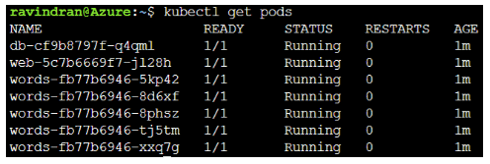
- Observe here that we have one pod for both database and web front end. We also have five replica pods for words API, as described in the YAML file.
- Use the kubectl get service command to get the external IP of our services. Initially, it takes some time to propagate the external IP. After some time, it changes from “pending state” to a newly created external IP address.
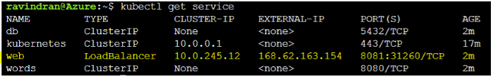
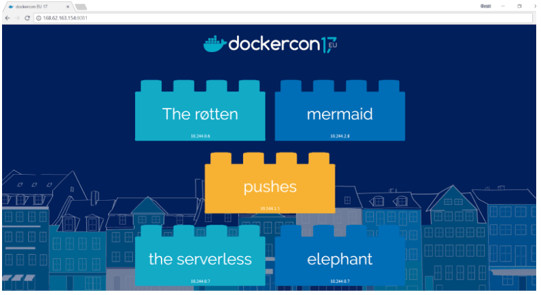
- We can now browse to the external IP address of our front-end web app by visiting http://<external-ip-of-web-service-app>:8081
- Refresh the page to see different sentences generated by the API calls.
Azure Monitor container health
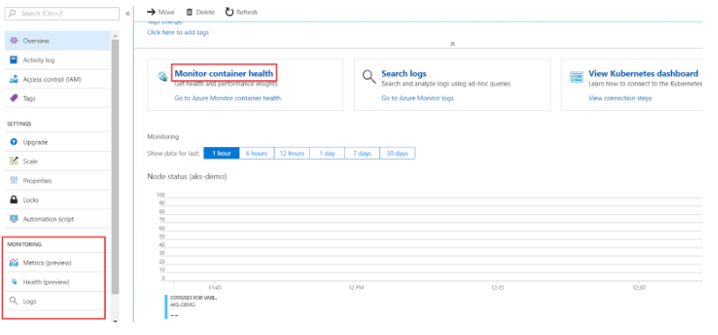
As a user, Azure Monitor container health lets us inspect Kubernetes objects (e.g., clusters, services, workloads, pods, containers) within our deployed AKS cluster. The log analytics tool helps us understand the behavior of an application, as well as analyze failures and optimize performance bottlenecks. From our Azure portal:- Navigate to AKS cluster dashboard and select Health service from the left side pane or you can directly select Monitor container health on the cluster overview.
- Once on the health dashboard; we can see a list of available Kubernetes objects such as nodes, controllers and containers of our AKS cluster. We can also filter metrics based on CPU and memory usage. As per the official Azure documentation, it takes around 15 mins to see the cluster data on monitoring dashboard (1 bar in the graph).
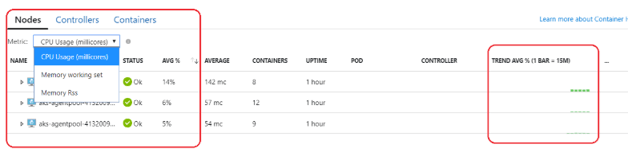
- Expand the dropdown on one of the nodes to see all the containers running on top of their respective pods. I am selecting the node aks-agentpool-41320097-1 here; as we can see, it consists of the web front end, database and API containers of our demo application. This row also shows container status, average CPU usage, pods and controller to which the container is associated. The most important feature of the monitoring solution is the ability to directly view the logs of the containers instead of doing it a more traditional way.
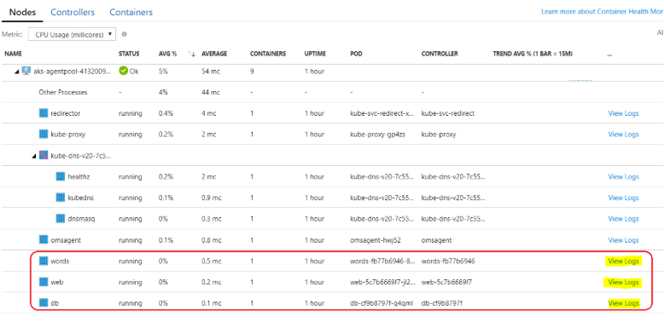
- The View logs feature is very useful in a production environment, as log analytics gives us the ability to run real-time queries on container logs. This helps in rapidly decreasing the time required to find a root cause of an issue. Click on “View logs” of the container which you would like to inspect, This will take us to the “Log Analytics” tab. Select a pre-defined query or write your own custom query to get detailed logs.
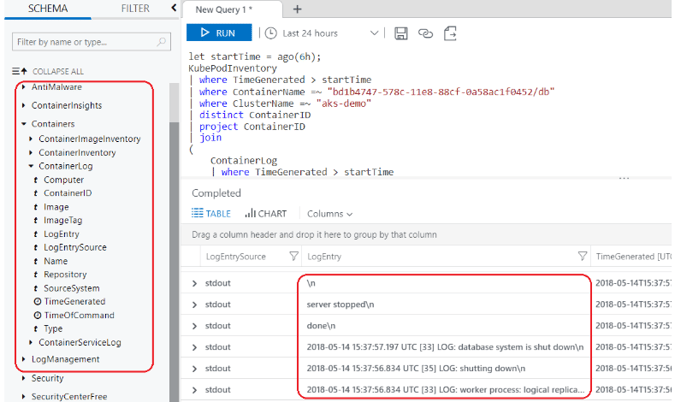
- We can see the query results returned for our database container from the log analytics workspace. As we discussed earlier, all the container logs are sent to the central workspace repository and from there, the log search is able to retrieve the data. There are also pre-defined queries such as searching for logs based on container ID, image name,etc., where you can use it to easily run on any of the containers and see results instantly. These logs include both stdout and stderr streams from the containers.

