(In the previous post, Part 4, we covered Compression and Bloom Filters)
In this blog post, we continue on our series of exploring MyRocks mechanics by looking at the configurable server variables and column family options. In our last post, I explained at a high level how compression and bloom filtering are applied to data files as they are initially flushed from immutable memtables and are subsequently passed through the compaction process. With that being covered, we should now have a clear understanding as to how data writing works in MyRocks and can start reviewing how data read requests are handled.
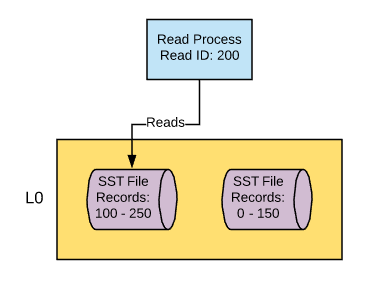
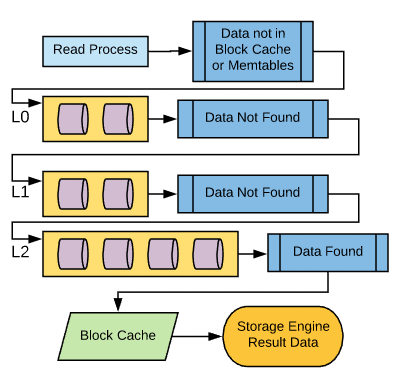
 For disk lookups, the process is going to start at the top-most (L0) compaction layer. Given what we’ve covered about compaction, we know that this is where we’ll find the newest version of the data record. Additional lookups will be performed on each compaction layer from top to bottom as needed until the record is found.
With the exception of L0, each compaction layer will have non-overlapping data files in sequence. Each file will be able to designate the upper and lower boundaries of its key values. So the very first thing a read process is going to do when it’s reading from a compaction layer is determine which file the key resides in, given that upper and lower boundary. There are also built-in pointers in the SST files that can be used to speed up the candidate file selection process that you can read about
here
.
For disk lookups, the process is going to start at the top-most (L0) compaction layer. Given what we’ve covered about compaction, we know that this is where we’ll find the newest version of the data record. Additional lookups will be performed on each compaction layer from top to bottom as needed until the record is found.
With the exception of L0, each compaction layer will have non-overlapping data files in sequence. Each file will be able to designate the upper and lower boundaries of its key values. So the very first thing a read process is going to do when it’s reading from a compaction layer is determine which file the key resides in, given that upper and lower boundary. There are also built-in pointers in the SST files that can be used to speed up the candidate file selection process that you can read about
here
.
 Once a candidate data file has been established based on the key range, its bloom filter data (filter pages) will be pulled into memory, assuming that bloom filtering is enabled, caching for filter pages is enabled, and the filter pages in question are not already in the cache. If caching is not enabled, the bloom filter data will be read directly from the file without caching. The key value will be hashed and checked against the bloom filter to determine if the key value is in the data file. If bloom filtering shows that the key is not in the file, the data file is ignored and the process moves on to the next compaction layer. If bloom filtering shows the data might be in the file (remember, it can’t be 100% sure) or bloom filtering is disabled, it moves onto the next step.
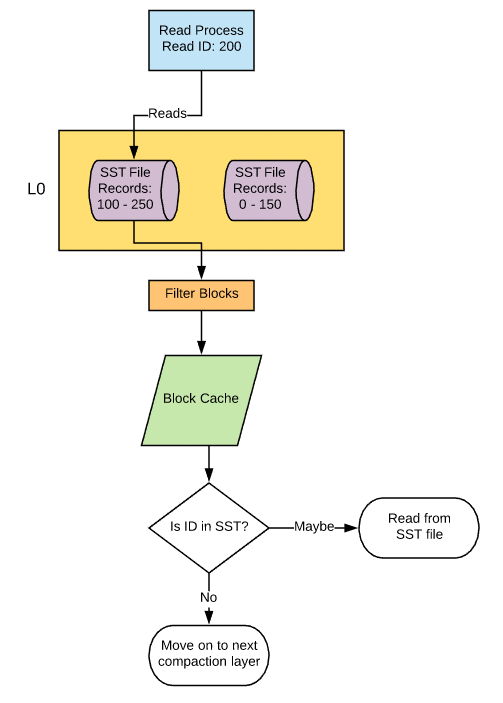 The data file is opened and the top-level index is checked to determine which data block the key can be found in and where that block can be found in the data file. This data block is then pulled into the block cache and then evaluated to determine if the value is present. If not, it will move on to the next compaction layer.
The Read Process
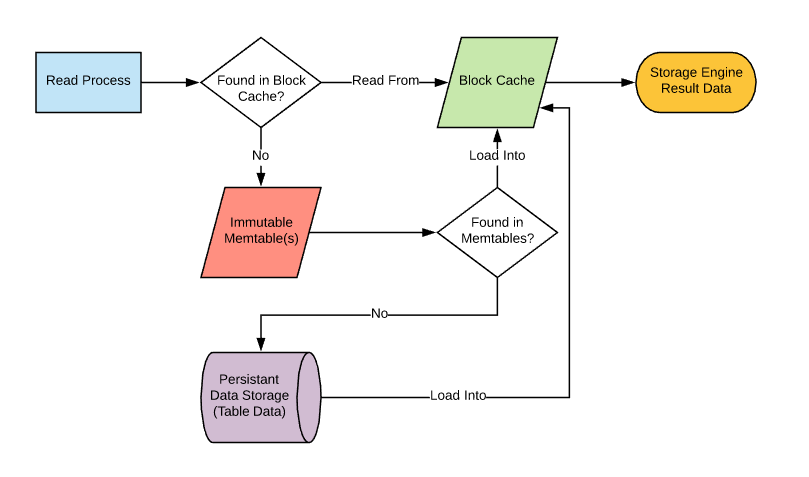
Let’s start off by talking about how read processes are handled at the file level. When a read request comes in, the first thing it needs to do is pull the data into memory - the block cache specifically - if it’s not already there. Assuming the data is not already available in the block cache, this is the point where a read from write-based sources will occur starting with memtables and then disk.
For disk lookups, the process is going to start at the top-most (L0) compaction layer. Given what we’ve covered about compaction, we know that this is where we’ll find the newest version of the data record. Additional lookups will be performed on each compaction layer from top to bottom as needed until the record is found.
With the exception of L0, each compaction layer will have non-overlapping data files in sequence. Each file will be able to designate the upper and lower boundaries of its key values. So the very first thing a read process is going to do when it’s reading from a compaction layer is determine which file the key resides in, given that upper and lower boundary. There are also built-in pointers in the SST files that can be used to speed up the candidate file selection process that you can read about
here
.
Once a candidate data file has been established based on the key range, its bloom filter data (filter pages) will be pulled into memory, assuming that bloom filtering is enabled, caching for filter pages is enabled, and the filter pages in question are not already in the cache. If caching is not enabled, the bloom filter data will be read directly from the file without caching. The key value will be hashed and checked against the bloom filter to determine if the key value is in the data file. If bloom filtering shows that the key is not in the file, the data file is ignored and the process moves on to the next compaction layer. If bloom filtering shows the data might be in the file (remember, it can’t be 100% sure) or bloom filtering is disabled, it moves onto the next step.
The data file is opened and the top-level index is checked to determine which data block the key can be found in and where that block can be found in the data file. This data block is then pulled into the block cache and then evaluated to determine if the value is present. If not, it will move on to the next compaction layer.
Variables and CF_OPTIONS
Now that we know the basics of how reads work, let’s take a closer look at the mechanics involved and the variables that control them.Rocksdb_no_block_cache
When you request a read from MyRocks, the first thing that it will do is check to see if the data is already in the block cache, except if you have the block cache disabled. This can be controlled by the variable rocksdb_no_block_cache. Default: OFF I would highly recommend that this variable remain enabled as the block cache is an essential feature of MyRocks for reads. The only reason I would consider disabling this is if I had an installation of Percona Server with MyRocks installed but had no intention of using MyRocks. At the time of this writing, Percona Server does come with MyRocks binaries, but it doesn’t come with MyRocks enabled, meaning that you would need to take extra steps with ps-admin to enable MyRocks on your instance . Ultimately I would suggest that the better option here would be to abstain from installing MyRocks if you don’t intend to use it as opposed to installing it and disabling its caches.Rocksdb_block_cache_size
Alright, let’s try that again. When you request a read from MyRocks, the first thing it will do is check to see if the data is already in the block cache. If it’s not already in the block cache, it will retrieve the data from memtables or data files using the process we outlined earlier in this post and then load it into the block cache so it can then be parsed as part of the effort to resolve the query in question. For those of you that are familiar with InnoDB this is going to sound a lot like the innodb buffer pool . The block cache will store the uncompressed record data, meaning that if you are using compression at the compaction layer where the data was retrieved, it will be decompressed before it’s loaded into the block cache. The block cache will also hold onto top-level index data, which specifies the range of each data block within the data file. It also holds filter blocks (bloom filter data) comprising the whole bloom filter or just part of it if you are using partitioned bloom filters. See my previous post on bloom filters for more information on partitioned bloom filters. As you can see, the block cache is critical to read processes for MyRocks and it’s important that you give it enough space to work with. The size of this cache is designated by the system variable rocksdb_block_cache_size Default: 536870912 (512 Mb) Much like the InnoDB Buffer pool, you are going to want to expand this variable so it is large enough to fix as much of your uncompressed active data set as possible in memory. I would recommend configuring this to be somewhere between 60 - 75% of your system’s memory capacity. However, you may need to be more conservative when sizing this cache in the case that you’re using compressed data, which we’ll address by explaining Rocksdb_use_direct_reads.Rocksdb_use_direct_reads
When data is read from disk, you have the option of getting data directly from the disk with no OS-level caching, but in the case of MyRocks, the operating system level disk cache may be fairly important. The reason is because in MyRocks you are unable to create a second block cache specifically for compressed data despite the fact that this is an available option in RocksDB, at least as far as I was able to determine with my testing. Given that you don’t have the option within the engine itself to cache compressed data pages, you may want to allow the operating system to do that for you. For those of you who are familiar with MYISAM , you may be able to see some similarities here. With MYISAM, the only thing that’s stored in the key cache is index blocks. It’s reliant on the operating system to store data blocks within the disk cache. Similarly, you would be reliant on the operating system disk cache to house compressed MyRocks data pages. This is an important mechanic to understand when looking at the system variable rocksdb_use_direct_reads, given that when it’s enabled you will lose the ability to use the operating system disk cache during data reads. Default: OFF If you have opted to not use any form of compression for your data set (see my previous section on compression and bloom filters), then you may actually stand to see an improvement by enabling this feature as there would be no compressed data that you would need to concern yourself with. However, common use cases for MyRocks almost always include compression, so I think it’s unlikely that you would ever want to enable this variable.Rocksdb_skip_fill_cache
There may be situations where you want to read data, but don’t want to have read data pulled into the block cache. The most common example of this when you create a logical dump using a tool like mysqldump or mydumper that will use data reads to facilitate the creation of the backup. During this time you could invalidate a large portion if not all of your active data set to create this backup should this data be cached on read. For those of you who are familiar with InnoDB, their solution was to use the variable innodb_old_blocks_time to state that read data could go to the buffer pool as part of the old page list, but a certain amount of time had to elapse before accessing again would allow it to be moved up to the new page list. This assured that the active dataset within the new page list in the buffer pool would not be overrun by logical backup processes. In MyRocks, things work a little differently as there is a single LRU list for the block cache. If you want to do reads without evicting anything already in the block cache, you can do so by using the rocksdb_skip_fill_cache variable. When set to ‘ON’, data will not be cached; however, with my testing, I did find that a small number of bytes were added to the block cache, but I can only assume that this is top-level index data and filter blocks. Default: OFF Given that this variable can be configured at the session level, I would be resistant to ever changing this variable at a global level. But I would consider setting the variable to ON in my.cnf in the [mysqldump] group.Rocksdb_skip_bloom_filter_on_read
MyRocks also gives you the option to skip bloom filters on reads at the global and session level using the variable rocksdb_skip_bloom_filter_on_read. Default: OFF The only use case I can theorize where skipping bloom filters would be useful is if you were doing a rapid succession (serially or concurrently), perhaps as part of a batch process, where you were filtering based on the key of the record and you were 100% certain that the record existed. Remember, MyRocks is going to first determine which data file may have the record in question by checking the upper and lower boundaries of the file . Once that’s complete it will do a bloom filter check to determine if the key is not in the file in question. If you’re completely certain that the key is there, you may consider removing the bloom filter check.Rocksdb_sim_cache_size
One common problem for caching of data is determining what the impact will be if you were to change the size of the cache. Assuming you were getting a lot of cache misses, you may wonder how much more memory you need to add to your system in order to increase your cache to get a better hit ratio. Perhaps you have a large hit ratio and you want to see how much you can reduce the block cache in order to make room for other caches such as the write buffer without causing read performance degradation. This is one place where MyRocks truly shines as it comes with what’s called the simulation cache . Using the variable rocksdb_sim_cache_size, you can specify what block-size cache you would like to simulate and then leverage. The insight that this provides could greatly assist you in tuning your configuration for reads, but keep in mind it comes at about a 2% memory cost of the specified size. For example, if you set the simulation cache to 1Gb, in reality, it will consume about 21Mb of space in memory. Default: 0 (disabled) This variable should be used as needed as part of ongoing tuning exercised in order to ensure MyRocks is as efficient as possible. Just keep in mind that this variable is not dynamic, so enabling and disabling the simulated cache will require a restart of MySQL.Rocksdb_collect_sst_properties
Another important aspect of reading data is table statistics, which are used by the MySQL optimizer to determine which indexes to use as part of the execution path for the query. If you’re not familiar with the concepts of table statistics or cardinality, I would recommend reading this blog post by Ronald Bradford . Or you can check my blog post on statistics handling for InnoDB as I go into a bit of detail about it there. The important thing to know is how statistics are collected for the engine that you’re working with. In the case of MyRocks, the most common time that stats will be collected is when a data file is created . Due to the nature of compaction, we know that once a data file is written it will never be changed, so this is the optimal time to collect statistics. Whether or not statistics are calculated at this time is controlled by the system variable rocksdb_collect_sst_properties. Default: ON Table statistics are a very important part of the query optimization process so I would highly recommend leaving this in its default enabled state.Rocksdb_table_stats_sampling_pct
It’s common for table files to not be fully read as part of the statistics gathering process and instead only a sample of the file is read. This is true for other storage engines like InnoDB that control how much data is collected by noting how many pages should be analyzed. For MyRocks, the sample size of the data file is controlled by the system variable Rocksdb_table_stats_sampling_pct. Default: 10 It’s pretty rare that I’ve ever had to adjust an analysis sample size for statistics gathering and generally would only recommend it if you start experiencing slow queries and discover via the explain plan that the optimizer is selecting a less preferred index.Rocksdb_force_compute_memtable_stats / Rocksdb_force_compute_memtable_stats_cachetime
MyRocks also has the option of gathering statistics data from your memtables. As you’ll recall from my first blog post in the series, this is where data is initially written to before it’s flushed to disk. Given that this data exists completely in memory, there is no automated trigger for collecting statistics from the data within the memtable, and instead, it’s collected when a query is run. Once collected, the statistics data will be held for a period of time and during that time there will be no further collection from memtables triggered by queries being run against the instance. Whether or not statistics are collected from memtable is controlled by the system variable rocksdb_force_compute_memtable_stats. The period of time that this data is held is controlled by the system variable rocksdb_force_compute_memtable_stats_cachetime Default:- Rocksdb_force_compute_memtable_stats = ON
- Rocksdb_force_compute_memtable_stats_cachetime = 60000000 (microseconds) (1 minute)
Rocksdb_reset_stats
In the case that you’ve lost confidence in the statistics data collected by MyRocks, you can use the system variable rocksdb_reset_stats to flush out it’s statistics data without having to restart the instance. Default: OFF When I tested other variables that instructed the engine to take an action such as rocksdb_force_flush_memtable_now, I would set them to ‘ON’ then check again a moment later and found that they had set themselves back to ‘OFF” after the instruction to take action was received. With this variable, I found that this was not the case as I had to turn it ON and then manually turn it OFF.Associated Metrics
Here are some of the metrics you should pay attention to when it comes to data reads. You can find the following information using system status variables .- Rocksdb_rows_read: The number of rows read from MyRocks since the last MySQL restart. Keep in mind that if you read a row twice, it will count it as 2 reads.
- Rocksdb_bytes_read: The total amount of uncompressed bytes read from all MyRocks resources (memtable, cache, data file) since the last MySQL restart.
- Rocksdb_block_cache_add: The number of blocks of any type added to the block cache since the last MySQL restart.
- Rocksdb_block_cache_data_add: The number of data blocks added to the block cache since the last MySQL restart.
- Rocksdb_block_cache_bytes_read: The number of bytes read from the block cache since the last MySQL restart.
- Rocksdb_block_cache_bytes_write: The number of bytes written to the block cache since the last MySQL restart.
- Rocksdb_block_cache_data_hit: Shows the number of times that a data block was accessed from the block cache without having to go to disk during a read request since the last MySQL restart.
- Rocksdb_block_cache_data_miss: Shows the number of times that a data block was not found in the block cache resulting in a request from disk during a read request since the last MySQL restart
- Rocksdb_block_cache_hit: Shows the total number of block cache hits (data blocks, top-level index blocks, filter blocks, etc) during read requests since the last MySQL restart.
- Rocksdb_block_cache_miss: Shows the total number of block cache misses (data blocks, top-level index blocks, filter blocks, etc) during read requests since the last MySQL restart.
- Rocksdb_get_hit_l0: The number of times that read requests got data from compaction layer L0 since the last MySQL restart.
- Rocksdb_get_hit_l1: The number of times that read requests got data from compaction layer L1 since the last MySQL restart.
- Rocksdb_get_hit_l2_and_up: The number of times that read requests got data from compaction layer L2 or lower since the last MySQL restart.
- Rocksdb_no_file_errors: The number of times an error occurred while trying to read data from a data file since the last MySQL restart.
- Rocksdb.sim.block.cache.hit
- Rocksdb.sim.block.cache.miss

