A couple of weeks ago I had a discussion about AWS RDS with one of my colleagues and he mentioned some unexpected IO problem during migration. It was during production cutover when they switched from the old environment on-prem to the freshly restored database on RDS. The migration itself is out of scope for the today's topic. We are going to point our attention to the unexpected IO problem. They should have plenty of IO bandwidth and everything was totally fine when they tested it before, but somehow many of the queries to the database were performing extremely slow for around 30 or 40 minutes and even after that they observed sporadic spikes in the number of sessions waiting for IO. After a couple of additional questions, it was more or less clear that they most likely hit a known problem described in AWS documentation. I am talking about "First touch penalty" on AWS. For this topic, I will use an Oracle RDS database to demonstrate the issue and how you can prepare for it. AWS documentation doesn't call it the "first touch penalty" anymore or maybe they have moved the page with the definition somewhere; I was not able to find even I though know it was there before. Still, you can read about it in the storage section on Elastic Block Storage (EBS) performance. In short, if you restore your RDS database or your EBS volume(s) from a snapshot the IO performance can drop below 50 percent of the expected level. It doesn't apply to any newly created volumes, only to those restored from a snapshot. When will it hit you? In my experience, I've seen it happen when people were testing migration procedure saving EBS volumes or creating snapshot backups for an RDS database before a migration to AWS. When the actual migration starts, the snapshot is restored and the migration process is severely delayed or even cancelled because the final cut-off took much more time than expected or performance was extremely impacted. In some cases, it was the final copying of the data to AWS, and in other cases, it was the final replication piece which was working slower than during pre-migration tests. How bad can it be? The problem appears only when you read a block first time. So, it depends on how many different blocks are going to be touched the first time. All subsequent IO operations with the blocks will be performed with the expected speed, and performance will be as good as expected even after rebooting an RDS or an instance. To demonstrate the issue I've prepared a simple test on Oracle RDS database with a straightforward select from a big 4Gb table just after restoring from a snapshot and using the same query again after restarting the instance. In both cases Oracle has chosen direct path read to access the data and we can see the difference in direct path read average waits and the total time for execution. Let's look a bit closer at both runs. Here is a table used for the tests:
 We had 630808 physical reads per run and it took about four minutes and 44 seconds to complete. Oracle has chosen direct path read access to get the data in our case and it looked the same from AWR data. Now we can repeat our query and compare timings and numbers for the wait events. Since we've read all the blocks the impact from the "first touch" should be eliminated. To be on the safe side the query is going to be repeated after the instance restart. And here is the same query executed after the reboot.
 We see exactly the same number of physical reads but the time has dropped from 4:44 to 1:20 minutes. The query ran 3.5 times faster. And when we look at the AWR data we can see that 'direct path read' average wait time dropped from 68 minutes to 16 minutes. Also, we can compare the AWS monitoring graphs for the first run :
 and for the second run:
 We clearly see that IOPS have increased from 128 read IOPS the first time to 433 read IOPS on the second run. It is more than three times more. It looks like the penalty is pretty high. Our IO performance dropped by almost 75 percent from normal after restoring from the snapshot. Considering that we have to be ready if we plan to do a production cutover using snapshot backups. Let's see what we can do about it. In the case of EBS volumes it is as simple as running "dd " command copying all the blocks from the volume to "/dev/null" on a Linux host. Of course it may take some time and in this case, knowing where the operational data is placed can reduce timing since you may not need to do it for an old or archived data. Unfortunately we cannot apply the same technique for RDS since we don't have direct access to the OS level and have to use SQL to read all data. We need not only read table data, but also indexes and any other segments like lob segments. To do so we may need to use a set of procedures to properly read all the necessary blocks at least once before going to production. As result, it can increase the cutover time or maybe lead to another migration strategy with a logical replication such as AWS DMS, Oracle GoldenGate, DBVisit or any similar tools.
 CREATE TABLE test.testtab02 AS
  SELECT LEVEL AS id,
  dbms_random.String('x', 8) AS rnd_str_1,
  SYSDATE - ( LEVEL + dbms_random.Value(0, 1000) ) AS use_date,
  dbms_random.String('x', 8) AS rnd_str_2,
  SYSDATE - ( LEVEL + dbms_random.Value(0, 1000) ) AS acc_date
  FROM dual
  CONNECT BY LEVEL < 1
 /
 INSERT /*+ append */ INTO test.testtab02
 WITH v1
  AS (SELECT dbms_random.String('x', 8) AS rnd_str_1,
  SYSDATE - ( LEVEL + dbms_random.Value(0, 1000) ) AS use_date
  FROM dual
  CONNECT BY LEVEL < 10000),
  v2
  AS (SELECT dbms_random.String('x', 8) AS rnd_str_2,
  SYSDATE - ( LEVEL + dbms_random.Value(0, 1000) ) AS acc_date
  FROM dual
  CONNECT BY LEVEL < 10000)
 SELECT ROWNUM AS id,
  v1.rnd_str_1,
  v1.use_date,
  v2.rnd_str_2,
  v2.acc_date
 FROM v1,
  v2
 /
The table is simple and about 4Gb in size without any indexes. To eliminate potential impact of network and other factors I've used "select count(*)". After creating and filling the table with data I took a snapshot from my RDS instance and restored it to another RDS instance. All the tests have been done on the latest RDS Oracle 12.1.0.2 v11 EE on db.t2.medium instance. Now we can look at the query and the results.
 orcl> set timing on
 orcl> set autotrace traceonly
 orcl> select count(*) from TESTTAB02;

 Elapsed: 00:04:43.56

 Execution Plan
 ----------------------------------------------------------
 Plan hash value: 3686556234

 ------------------------------------------------------------------------
 | Id | Operation | Name | Rows | Cost (%CPU)| Time |
 ------------------------------------------------------------------------
 | 0 | SELECT STATEMENT | | 1 | 3 (0)| 00:00:01 |
 | 1 | SORT AGGREGATE | | 1 | | |
 | 2 | TABLE ACCESS FULL| TESTTAB02 | 1 | 3 (0)| 00:00:01 |
 ------------------------------------------------------------------------


 Statistics
 ----------------------------------------------------------
  26 recursive calls
  0 db block gets
  630844 consistent gets
  630808 physical reads
  0 redo size
  530 bytes sent via SQL*Net to client
  511 bytes received via SQL*Net from client
  2 SQL*Net roundtrips to/from client
  5 sorts (memory)
  0 sorts (disk)
  1 rows processed

 orcl>
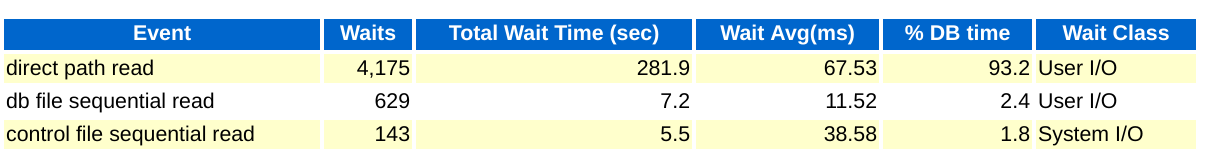
And here is an excerpt from an AWR report for the run:
We had 630808 physical reads per run and it took about four minutes and 44 seconds to complete. Oracle has chosen direct path read access to get the data in our case and it looked the same from AWR data. Now we can repeat our query and compare timings and numbers for the wait events. Since we've read all the blocks the impact from the "first touch" should be eliminated. To be on the safe side the query is going to be repeated after the instance restart. And here is the same query executed after the reboot.
 orcl> set timing on
 orcl> set autotrace traceonly
 orcl> select count(*) from TESTTAB02;

 Elapsed: 00:01:19.98

 Execution Plan
 ----------------------------------------------------------
 Plan hash value: 3686556234

 ------------------------------------------------------------------------
 | Id | Operation | Name | Rows | Cost (%CPU)| Time |
 ------------------------------------------------------------------------
 | 0 | SELECT STATEMENT | | 1 | 3 (0)| 00:00:01 |
 | 1 | SORT AGGREGATE | | 1 | | |
 | 2 | TABLE ACCESS FULL| TESTTAB02 | 1 | 3 (0)| 00:00:01 |
 ------------------------------------------------------------------------


 Statistics
 ----------------------------------------------------------
  26 recursive calls
  0 db block gets
  630844 consistent gets
  630808 physical reads
  0 redo size
  530 bytes sent via SQL*Net to client
  511 bytes received via SQL*Net from client
  2 SQL*Net roundtrips to/from client
  5 sorts (memory)
  0 sorts (disk)
  1 rows processed

 orcl>
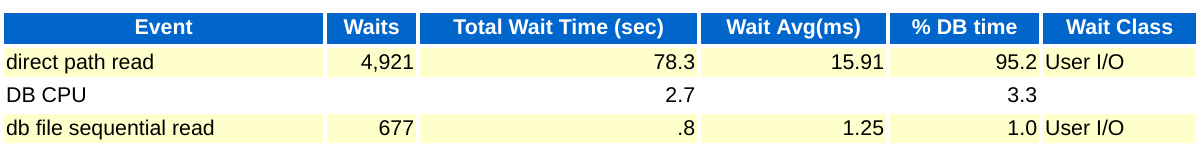
And here is the AWR for the second run:
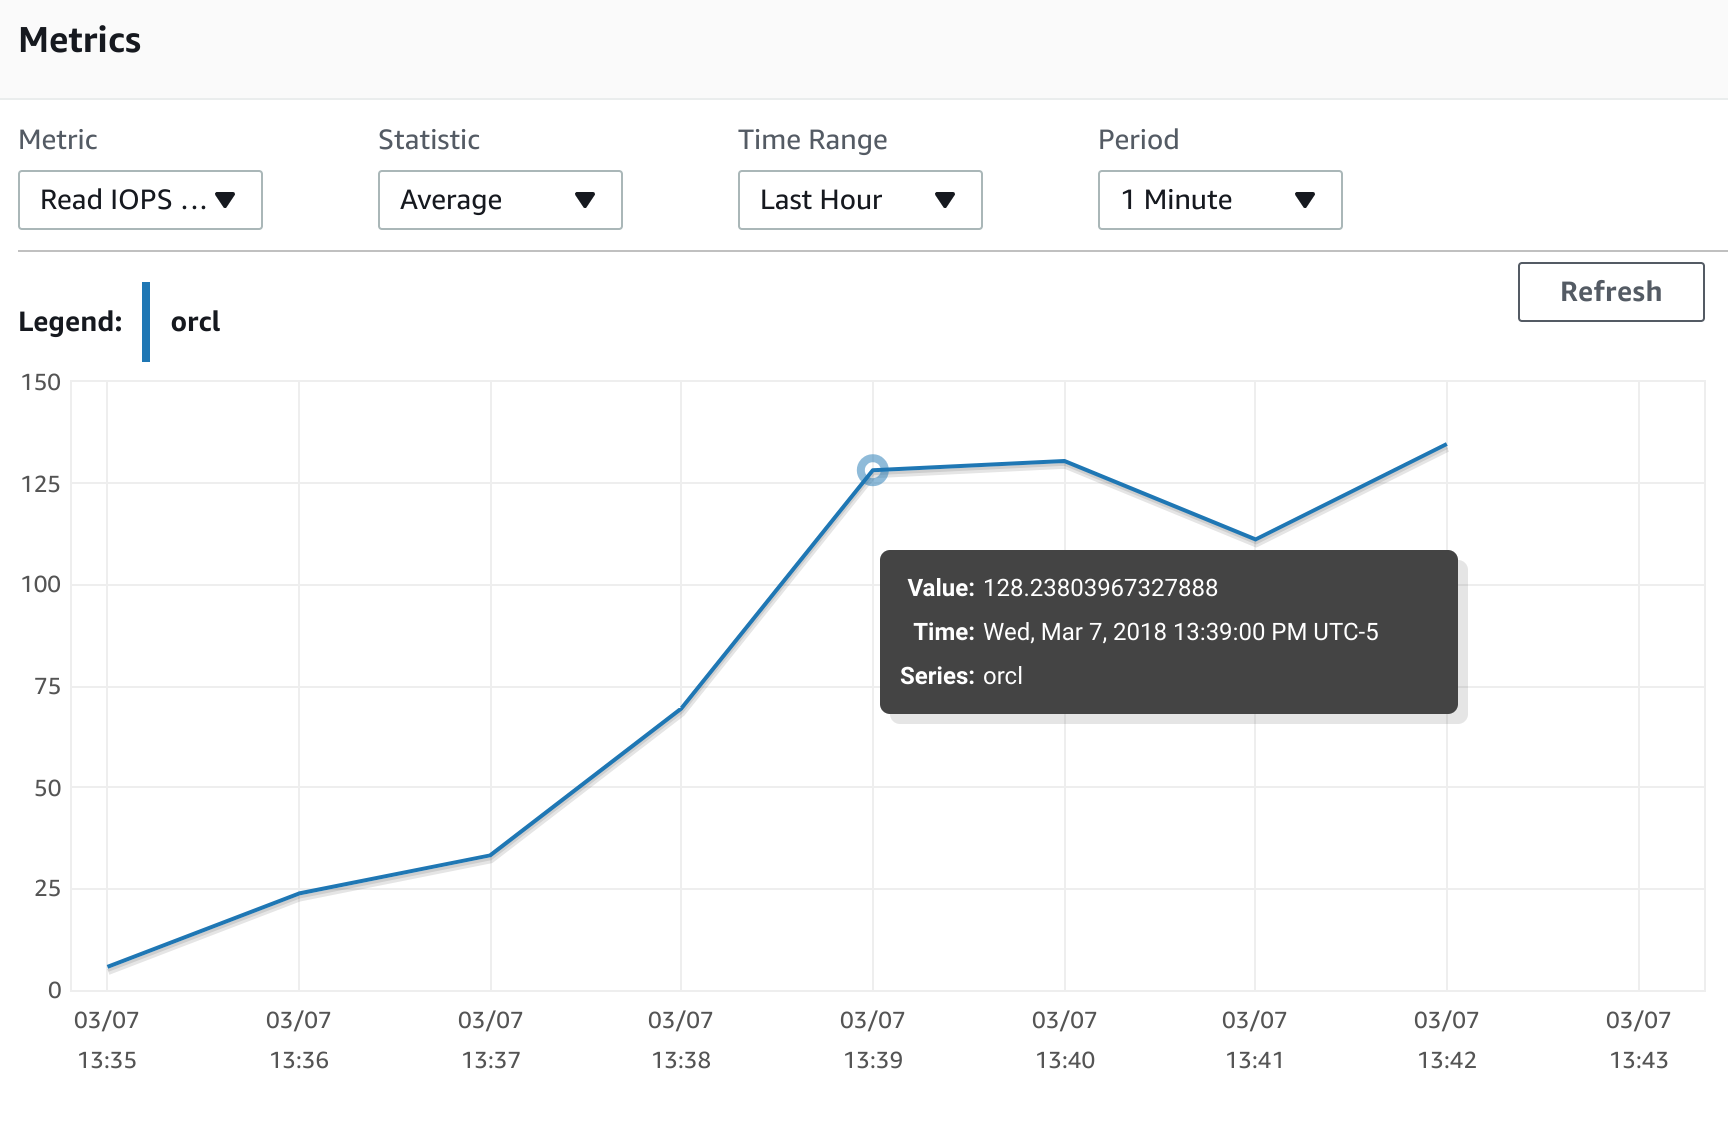
We see exactly the same number of physical reads but the time has dropped from 4:44 to 1:20 minutes. The query ran 3.5 times faster. And when we look at the AWR data we can see that 'direct path read' average wait time dropped from 68 minutes to 16 minutes. Also, we can compare the AWS monitoring graphs for the first run :
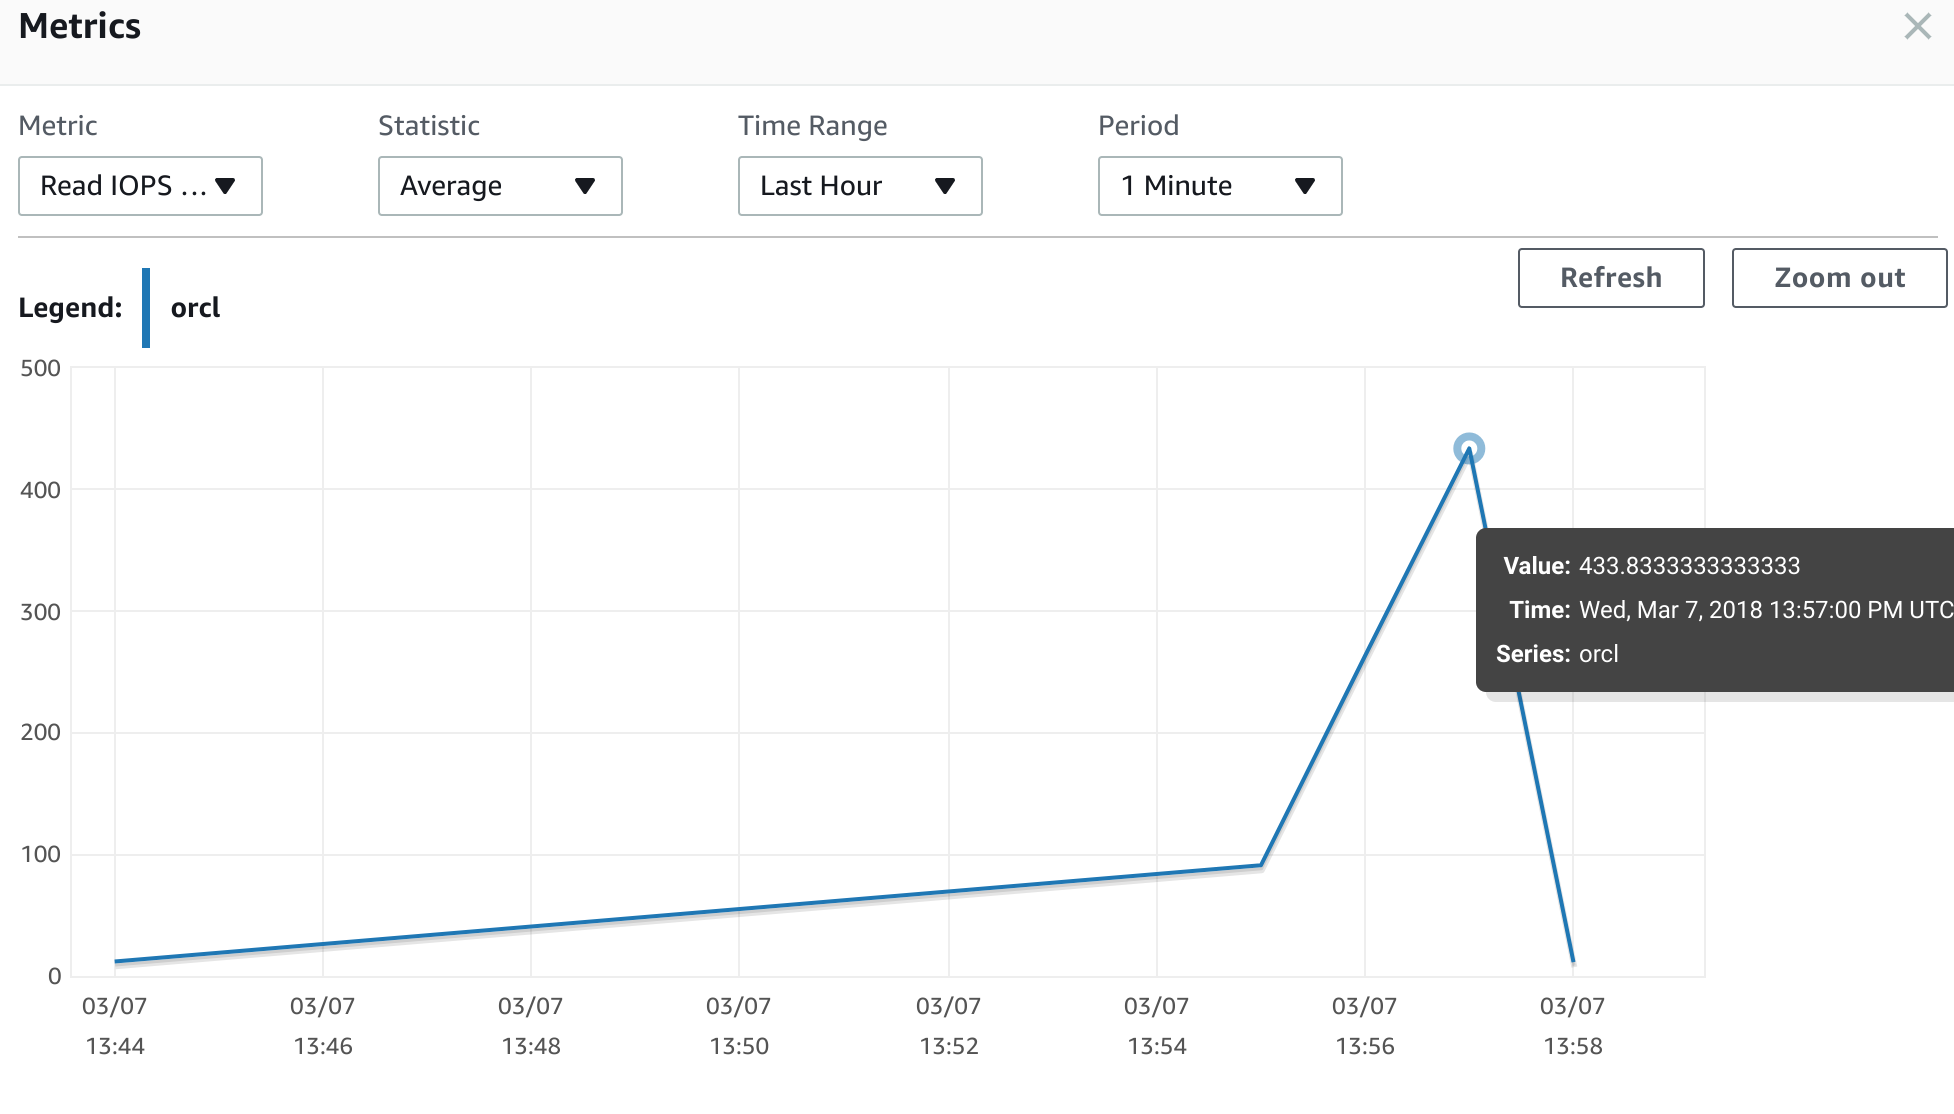
and for the second run:
We clearly see that IOPS have increased from 128 read IOPS the first time to 433 read IOPS on the second run. It is more than three times more. It looks like the penalty is pretty high. Our IO performance dropped by almost 75 percent from normal after restoring from the snapshot. Considering that we have to be ready if we plan to do a production cutover using snapshot backups. Let's see what we can do about it. In the case of EBS volumes it is as simple as running "dd " command copying all the blocks from the volume to "/dev/null" on a Linux host. Of course it may take some time and in this case, knowing where the operational data is placed can reduce timing since you may not need to do it for an old or archived data. Unfortunately we cannot apply the same technique for RDS since we don't have direct access to the OS level and have to use SQL to read all data. We need not only read table data, but also indexes and any other segments like lob segments. To do so we may need to use a set of procedures to properly read all the necessary blocks at least once before going to production. As result, it can increase the cutover time or maybe lead to another migration strategy with a logical replication such as AWS DMS, Oracle GoldenGate, DBVisit or any similar tools.