In one of the projects I have been working on, one requirement was the ability to stop traffic from reaching a MySQL host which has been lagging behind its master for longer than a specific amount of time and then bring it back online once the lag has gone away. Of course, this is all automated and no human intervention is required. In this scenario, we are using HAProxy as the load balancer, and I will walk you through how to configure an agent so we can use HAProxy httpchk to flag the host as up or down, via systemd socket and then automatically set the host as being down/up when applicable, in HAProxy. I will be setting up a systemd service (I'm running centos7 hosts) and creating a listening socket in the MySQL host we want to monitor so haproxy can have access to replication status.
Scenario: master: po-mysql1 slaves: po-mysql2, po-mysql3, po-mysql4 secondary slaves: po-slave1
 2. Stop slave thread on po-mysql2 (master of po-slave1) so it will cause a lag on po-slave1:
 Now restart the slave thread and notice the host is brought back online in haproxy, logs and screenshots below:

 Conclusion: This setup allows us to automatically flag a host down based on slave lag and bring it back online as soon as the lag has subsided, thus preventing traffic from hitting hosts which are too far behind the master. This is a simple use case, but it will get you going in the right direction and give you a starting point.
[root@po-proxysql1 orchestrator]# orchestrator-client -c topology -i po-mysql1:53306
 po-mysql1:53306 [0s,ok,5.7.21-21-log,rw,MIXED,>>,GTID]
 + po-mysql2:53306 [0s,ok,5.7.21-21-log,ro,MIXED,>>,GTID]
 + po-slave1:53306 [0s,ok,5.7.21-21-log,ro,MIXED,>>,GTID]
 + po-mysql3:53306 [0s,ok,5.7.21-21-log,ro,MIXED,>>,GTID]
 + po-mysql4:53306 [0s,ok,5.7.21-21-log,ro,MIXED,>>,GTID]
Setup: We need to create the following scripts in each MySQL host we want to monitor. For simplicity, I have configured this on one server only (po-slave1), but you can extend this to as many hosts as you wish. 1. Create the script to check the lag on your MySQL host being monitored (this assumes you are using pt-heartbeat. If not, just change the query below to get the output from show slave status Seconds_Behind_Master). Make sure to change port if applicable, and of course the credentials file:
[root@po-slave1 opt]# pwd
 /opt
[root@po-slave1 opt]# cat mysqlchk.sh
 #!/bin/bash
 # Variables:
 MYSQL_HOST="127.0.0.1"
 MYSQL_PORT="53306"
 MYSQL_CREDS="/etc/mysql.creds"
 acceptable_lag=5

 #
 # Status ok, return 'HTTP 200'
 #
 http_200 () {
 /bin/echo -e "HTTP/1.1 200 OK\r\n"
 /bin/echo -e "Content-Type: Content-Type: text/plain\r\n"
 /bin/echo -e "\r\n"
 /bin/echo -e "$1"
 /bin/echo -e "\r\n"
 }

 #
 # Status not ok, return 'HTTP 503'
 #
 http_503 () {
 /bin/echo -e "HTTP/1.1 503 Service Unavailable\r\n"
 /bin/echo -e "Content-Type: Content-Type: text/plain\r\n"
 /bin/echo -e "\r\n"
 /bin/echo -e "$1"
 /bin/echo -e "\r\n"
 }

 #
 # Server not found, maybe MySQL is down, return 'HTTP 404'
 #
 http_404 () {
  /bin/echo -e "HTTP/1.1 404 Not Found\r\n"
  /bin/echo -e "Content-Type: Content-Type: text/plain\r\n"
  /bin/echo -e "\r\n"
  /bin/echo -e "$1"
  /bin/echo -e "\r\n"
 }


 #
 # Run query against the local MySQL host
 #

 slave_lag=$(mysql --defaults-file=${MYSQL_CREDS} --host=${MYSQL_HOST} --port=${MYSQL_PORT} -e "select timestampdiff(SECOND, ts, now()) as 'mysql-lag' from percona.heartbeat;" -ss 2>/dev/null)
 exit_code=$?

 if [ "$exit_code" != "0" ] ; then
 http_404 "MySQL error"
 fi

 if [ $slave_lag -gt $acceptable_lag ] ; then
 http_503 "MySQL lagging"
 fi

 if [ $slave_lag -le $acceptable_lag ] ; then
 http_200 "Lag OK"
 fi
2. Create service and socket files in the location below (again, this needs to be done on MySQL host being monitored):
[root@po-slave1 system]# pwd
 /etc/systemd/system
[root@po-slave1 system]# cat mysqlchk@.service

 [Unit]
 Description=MySQL Check Service for HAProxy
 After=mysql.service
 Requires=mysqlchk.socket

 [Service]
 Type=simple
 RemainAfterExit=yes
 ExecStart=-/bin/bash /opt/mysqlchk.sh
 Restart=always
 StandardInput=socket

 [Install]
 WantedBy=multi-user.target
[root@po-slave1 system]# cat mysqlchk.socket

 [Unit]
 Description=MySQL Check Socket for HAProxy
 PartOf=mysqlchk@.service

 [Socket]
 ListenStream=0.0.0.0:9876
 Accept=true

 [Install]
 WantedBy=sockets.target
3. Start the service on the MySQL host being monitored and check the status:
[root@po-slave1 system]# systemctl start mysqlchk.socket

 [root@po-slave1 system]# systemctl status -l mysqlchk.socket
 ? mysqlchk.socket - MySQL Check Socket for HAProxy
 Loaded: loaded (/etc/systemd/system/mysqlchk.socket; disabled; vendor preset: disabled)
 Active: active (listening) since Wed 2018-06-06 17:35:20 UTC; 1h 3min ago
 Listen: 0.0.0.0:9876 (Stream)
 Accepted: 346; Connected: 0

 Jun 06 17:35:20 po-slave1 systemd[1]: Listening on MySQL Check Socket for HAProxy.
 Jun 06 17:35:20 po-slave1 systemd[1]: Starting MySQL Check Socket for HAProxy.
4. Go to your haproxy server and adjust haproxy.cfg and add the following lines (adjust to match your environment) for the hosts you would like to run the httpchk (we are running this only for po-slave1, as previously noted):
listen mysql-secondary-slaves
 bind :53307
 option httpchk
 option tcplog
 mode tcp
 server po-slave1 192.168.56.104:53306 check port 9876 inter 12000 rise 3 fall 3 on-marked-down shutdown-sessions
Steps 5-8 are optional: 5. Optional: configure haproxy logs. By default, haproxy does not log to its own file, so we need to do the following: edit /etc/rsyslog.conf and remove the comments from the following lines:
$ModLoad imudp
 $UDPServerRun 514
6. Optional: Create a file called /etc/rsyslog.d/haproxy.conf and add the following:
local2.* /var/log/haproxy.log
7. Optional: restart rsyslog:
service rsyslog restart
8. Optional: edit haproxy.cfg and make sure to have the following:
global
 log 127.0.0.1 local2
9. Reload the haproxy configuration:
[root@po-haproxy1 haproxy]# service haproxy reload
 Redirecting to /bin/systemctl reload haproxy.service
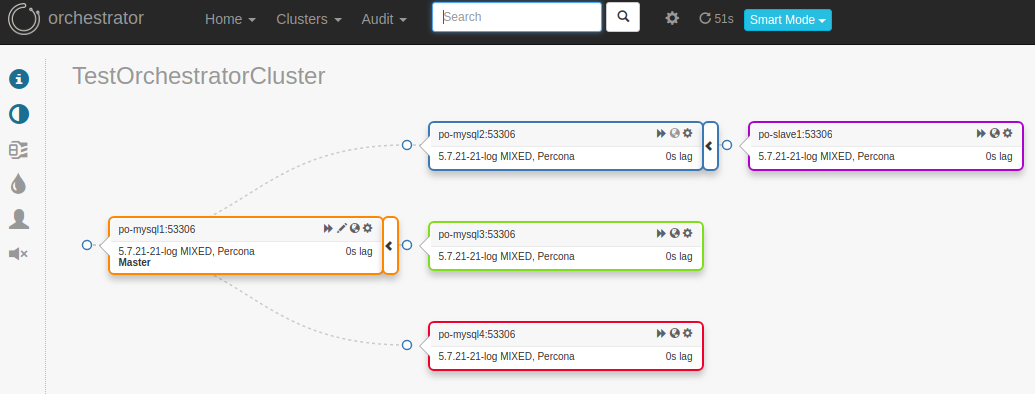
Test: Now let's run some tests and see how it works: po-mysql2 stops replicating from po-mysql1, which in turn, makes po-mysql2 and po-slave1 lag behind po-mysql1 (note - I only did this for one host, po-slave1, but you can extend the same to multiple hosts). 1. Here is the status and screenshots before we stop the slave threads to create some lag:
[root@po-haproxy1 haproxy]# echo "show stat" | socat stdio /etc/haproxy/haproxy.sock | cut -d ',' -f1,2,18,19 | grep -E "pxname,svname,status,weight|mysql-secondary-slaves"

 # pxname,svname,status,weight
 mysql-secondary-slaves,FRONTEND,OPEN,
 mysql-secondary-slaves,po-slave1,UP,1
 mysql-secondary-slaves,BACKEND,UP,1
[root@po-proxysql1 orchestrator]# orchestrator-client -c topology -i po-mysql1:53306
 po-mysql1:53306 [0s,ok,5.7.21-21-log,rw,MIXED,>>,GTID]
 + po-mysql2:53306 [0s,ok,5.7.21-21-log,ro,MIXED,>>,GTID]
 + po-slave1:53306 [0s,ok,5.7.21-21-log,ro,MIXED,>>,GTID]
 + po-mysql3:53306 [0s,ok,5.7.21-21-log,ro,MIXED,>>,GTID]
 + po-mysql4:53306 [0s,ok,5.7.21-21-log,ro,MIXED,>>,GTID]
2. Stop slave thread on po-mysql2 (master of po-slave1) so it will cause a lag on po-slave1:
(root@localhost) [(none)]>select @@hostname;
 +------------+
 | @@hostname |
 +------------+
 | po-mysql2 |
 +------------+
 1 row in set (0.00 sec)

 (root@localhost) [(none)]>stop slave;
 Query OK, 0 rows affected (0.02 sec)
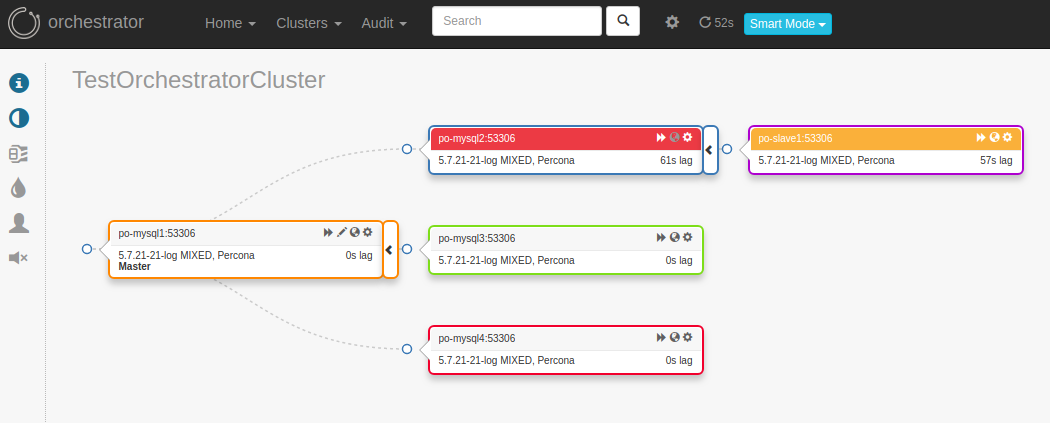
3. Check status. We notice that after three checks, po-slave1 is marked as down because the slave lag is greater than the lag we configured in the mysqlchk.sh script:
[root@po-proxysql1 orchestrator]# orchestrator-client -c topology -i po-mysql1:53306
 po-mysql1:53306 [0s,ok,5.7.21-21-log,rw,MIXED,>>,GTID]
 - po-mysql2:53306 [null,nonreplicating,5.7.21-21-log,ro,MIXED,>>,GTID]
 + po-slave1:53306 [21s,ok,5.7.21-21-log,ro,MIXED,>>,GTID]
 + po-mysql3:53306 [0s,ok,5.7.21-21-log,ro,MIXED,>>,GTID]
 + po-mysql4:53306 [0s,ok,5.7.21-21-log,ro,MIXED,>>,GTID]
[root@po-haproxy1 haproxy]# echo "show stat" | socat stdio /etc/haproxy/haproxy.sock | cut -d ',' -f1,2,18,19 | grep -E "pxname,svname,status,weight|mysql-secondary-slaves"
 # pxname,svname,status,weight
 mysql-secondary-slaves,FRONTEND,OPEN,
 mysql-secondary-slaves,po-slave1,UP 2/3,1
 mysql-secondary-slaves,BACKEND,UP,1

 [root@po-haproxy1 haproxy]# echo "show stat" | socat stdio /etc/haproxy/haproxy.sock | cut -d ',' -f1,2,18,19 | grep -E "pxname,svname,status,weight|mysql-secondary-slaves"
 # pxname,svname,status,weight
 mysql-secondary-slaves,FRONTEND,OPEN,
 mysql-secondary-slaves,po-slave1,UP 1/3,1
 mysql-secondary-slaves,BACKEND,UP,1

 [root@po-haproxy1 haproxy]# echo "show stat" | socat stdio /etc/haproxy/haproxy.sock | cut -d ',' -f1,2,18,19 | grep -E "pxname,svname,status,weight|mysql-secondary-slaves"
 # pxname,svname,status,weight
 mysql-secondary-slaves,FRONTEND,OPEN,
 mysql-secondary-slaves,po-slave1,DOWN,1
 mysql-secondary-slaves,BACKEND,DOWN,0
4.1. Check haproxy logs, if enabled:
[root@po-haproxy1 haproxy]# tailf /var/log/haproxy.log

 Jun 6 18:46:14 po-haproxy1 haproxy[11445]: Health check for server mysql-secondary-slaves/po-slave1 failed, reason: Layer7 wrong status, code: 503, info: "Service Unavailable", check duration: 121ms, status: 2/3 UP.
 Jun 6 18:46:26 po-haproxy1 haproxy[11445]: Health check for server mysql-secondary-slaves/po-slave1 failed, reason: Layer7 wrong status, code: 503, info: "Service Unavailable", check duration: 46ms, status: 1/3 UP.
 Jun 6 18:46:38 po-haproxy1 haproxy[11445]: Health check for server mysql-secondary-slaves/po-slave1 failed, reason: Layer7 wrong status, code: 503, info: "Service Unavailable", check duration: 44ms, status: 0/3 DOWN.
 Jun 6 18:46:38 po-haproxy1 haproxy[11445]: Server mysql-secondary-slaves/po-slave1 is DOWN. 0 active and 0 backup servers left. 0 sessions active, 0 requeued, 0 remaining in queue.
 Jun 6 18:46:38 po-haproxy1 haproxy[11445]: proxy mysql-secondary-slaves has no server available!
4.2. If haproxy logs is not enabled, you can check the status via the following:
journalctl -e -u haproxy.service
5. Finally, some screenshots depicting the lag and host being flagged as down due to slave lag:
Now restart the slave thread and notice the host is brought back online in haproxy, logs and screenshots below:
(root@localhost) [(none)]>select @@hostname;
 +------------+
 | @@hostname |
 +------------+
 | po-mysql2 |
 +------------+
 1 row in set (0.00 sec)

 (root@localhost) [(none)]>start slave;
 Query OK, 0 rows affected (0.01 sec)
[root@po-haproxy1 haproxy]# echo "show stat" | socat stdio /etc/haproxy/haproxy.sock | cut -d ',' -f1,2,18,19 | grep -E "pxname,svname,status,weight|mysql-secondary-slaves"
 # pxname,svname,status,weight
 mysql-secondary-slaves,FRONTEND,OPEN,
 mysql-secondary-slaves,po-slave1,DOWN 1/3,1
 mysql-secondary-slaves,BACKEND,DOWN,0

 [root@po-haproxy1 haproxy]# echo "show stat" | socat stdio /etc/haproxy/haproxy.sock | cut -d ',' -f1,2,18,19 | grep -E "pxname,svname,status,weight|mysql-secondary-slaves"
 # pxname,svname,status,weight
 mysql-secondary-slaves,FRONTEND,OPEN,
 mysql-secondary-slaves,po-slave1,DOWN 2/3,1
 mysql-secondary-slaves,BACKEND,DOWN,0

 [root@po-haproxy1 haproxy]# echo "show stat" | socat stdio /etc/haproxy/haproxy.sock | cut -d ',' -f1,2,18,19 | grep -E "pxname,svname,status,weight|mysql-secondary-slaves"
 # pxname,svname,status,weight
 mysql-secondary-slaves,FRONTEND,OPEN,
 mysql-secondary-slaves,po-slave1,UP,1
 mysql-secondary-slaves,BACKEND,UP,1
[root@po-haproxy1 haproxy]# tailf /var/log/haproxy.log

 Jun 6 19:00:31 po-haproxy1 haproxy[11445]: Health check for server mysql-secondary-slaves/po-slave1 succeeded, reason: Layer7 check passed, code: 200, info: "OK", check duration: 35ms, status: 1/3 DOWN.
 Jun 6 19:00:36 po-haproxy1 haproxy[11445]: Connect from 192.168.56.1:55724 to 192.168.56.108:8079 (stats/HTTP)
 Jun 6 19:00:43 po-haproxy1 haproxy[11445]: Health check for server mysql-secondary-slaves/po-slave1 succeeded, reason: Layer7 check passed, code: 200, info: "OK", check duration: 64ms, status: 2/3 DOWN.
 Jun 6 19:00:55 po-haproxy1 haproxy[11445]: Health check for server mysql-secondary-slaves/po-slave1 succeeded, reason: Layer7 check passed, code: 200, info: "OK", check duration: 64ms, status: 3/3 UP.
 Jun 6 19:00:55 po-haproxy1 haproxy[11445]: Server mysql-secondary-slaves/po-slave1 is UP. 1 active and 0 backup servers online. 0 sessions requeued, 0 total in queue.
[root@po-proxysql1 orchestrator]# orchestrator-client -c topology -i po-mysql1:53306
 po-mysql1:53306 [0s,ok,5.7.21-21-log,rw,MIXED,>>,GTID]
 + po-mysql2:53306 [0s,ok,5.7.21-21-log,ro,MIXED,>>,GTID]
 + po-slave1:53306 [0s,ok,5.7.21-21-log,ro,MIXED,>>,GTID]
 + po-mysql3:53306 [0s,ok,5.7.21-21-log,ro,MIXED,>>,GTID]
 + po-mysql4:53306 [0s,ok,5.7.21-21-log,ro,MIXED,>>,GTID]
Conclusion: This setup allows us to automatically flag a host down based on slave lag and bring it back online as soon as the lag has subsided, thus preventing traffic from hitting hosts which are too far behind the master. This is a simple use case, but it will get you going in the right direction and give you a starting point.

