A new client was experiencing regular issues with its OA Core servers on its EBS 12.2 environment. The issue caused high CPU usage on the OA Core nodes up to 100% and sometimes caused OutOfMemoryError to appear in the logs. Here’s what you need to understand and do to find out the culprit(s) of such issues.
Background
Please check this old yet still relevant post first to understand the basics of JVM threads. To recap: Java applications are thread based; to figure out which threads use CPUs, you can use the OS tool to find top CPU consumers and then use the JDK tool to find the thread details. If the threads are application threads, you will have thread stack(s) pointing to the exact place in the code responsible for high CPU usage. In the case of JVM utility threads, you will only have their names as those usually run native code and don’t have stack traces available in the jstack output.
Very often, those utility threads using a lot of CPU are Garbage Collector threads trying to free memory in a heap. If some code is allocating too much data in a heap, GC will have to work hard to find free space as it becomes less and less available. If the memory-hungry code doesn’t stop and keeps running, it can lead to an OutOfMemoryError or keep running for a long time with high CPU usage by GC threads. And that’s what happened to our client.
The Data
You will have to get a heap dump from a running OA core (WebLogic) process to identify what is using too much heap. Such a dump will have all the live objects, all the thread details, everything—so be careful to not share it outside. Passwords could easily be extracted from a heap dump. Usually, you use jmap for that:
jmap -dump:format=b,file=heap.hprof $OACORE_PID
where heap.hprof is the heap dump file name, and $OACORE_PID is the OA Core process ID. The output file heap.hprof will be written in the current directory.
The heap.hprof file is a binary file, and it can be opened with a Memory Analyzer—an open-source tool with GUI based on Eclipse. MAT is relatively easy to use; one issue you may most certainly hit is that to parse a large heap dump, MAT needs a large heap. The larger heap can be configured in the MemoryAnalyzer.ini file using vmargs, such as:
-vmargs
 -Xmx4096m
The Report
Once MAT parses the heap dump (which may take time depending on the heap file size), it suggests running a Leak Suspects report. The report gives you a nice visual diagram with suspected memory leaks. Here is what we’ve seen in the Leak Suspects Report:
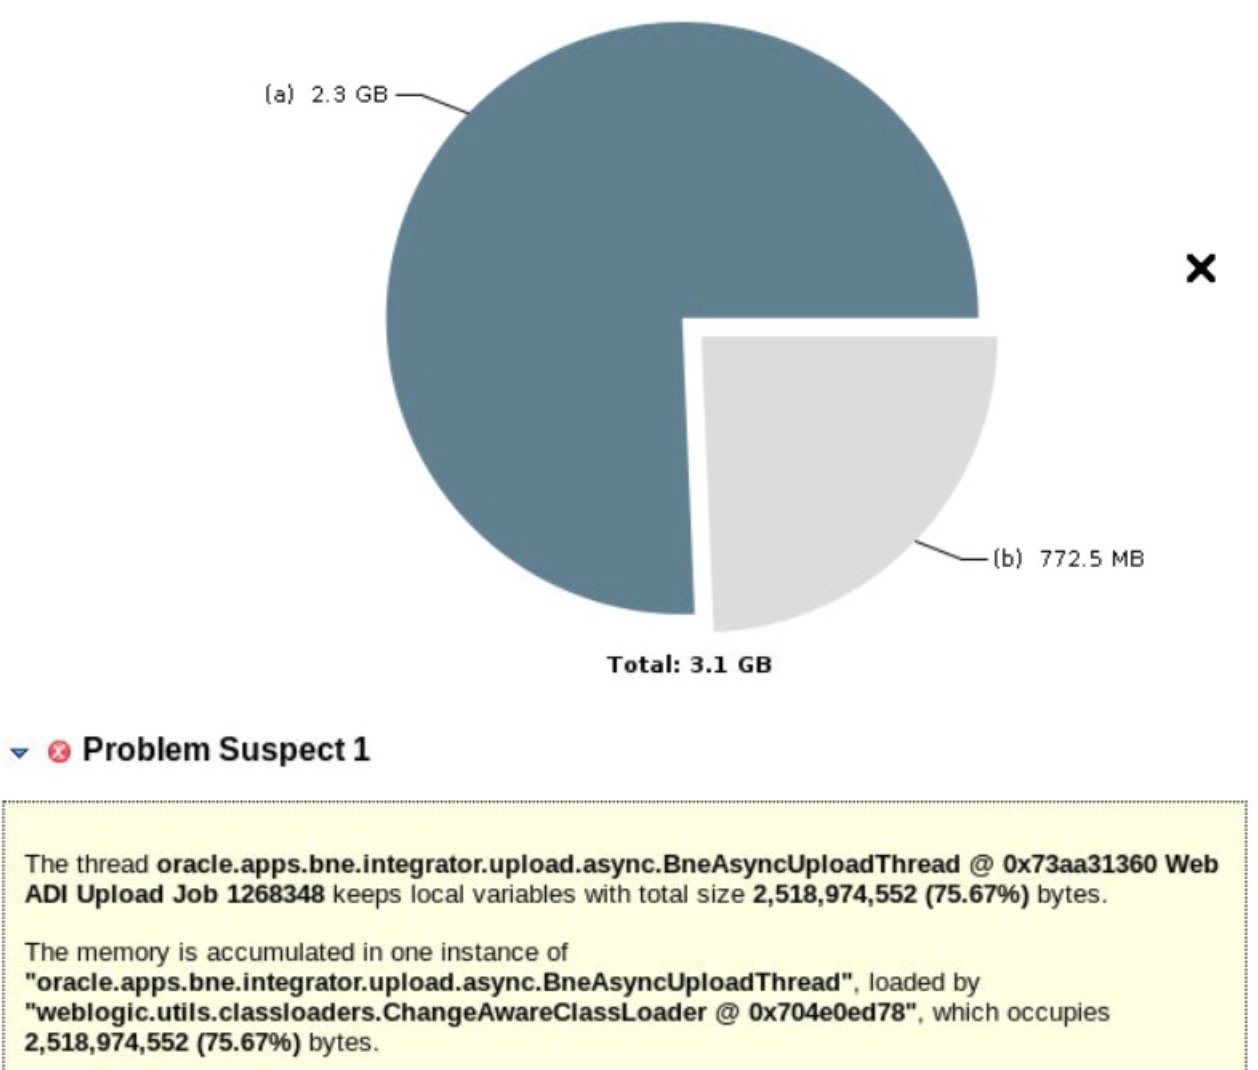
Looks like this oracle.apps.bne.integrator.upload.async.BneAsyncUploadThread allocated 2.3GB out of the 3.1GB heap. You can get a thread stack from there and all the objects referenced by this thread. Many things are available, including the user ID and Name, and the file name used for the WebADI upload.
The WebADI functionality provided by EBS parses Excel files uploaded by a user using Apache POI library. While the relevant data needed for EBS was located on the first Excel sheet and was just a few dozen of rows, there were many more additional sheets in that Excel file with thousands of rows each. That auxiliary data caused OA Core to use too much heap while parsing Excel spreadsheets. And this is a known issue for EBS: Web ADI: Uploading Large Documents Do Not Complete and Crashes the Oacore Server (Doc ID 2661833.1). There is a patch to limit the maximum file size by using a new profile option.
Summary
- It is possible to identify the root cause of high CPU usage by Garbage Collector in OA Cores with a help of a heap dump and Memory Analyzer
- There is an EBS patch to limit the maximum allowed file size for WebADI uploads

