
It’s not a stretch to say that data is taking over the world. You can see the signs everywhere, from news stories highlighting the breathtaking pace of data creation—projected to hit 163 zettabytes per day by 2025—to the ongoing and increasing use of data insights at your own organization.
Indeed, analytics isn’t just for nerds anymore. It’s now a team sport requiring buy-in from your entire employee roster, from the CEO on down to the most junior trainee, in order to drive the highest degree of performance improvements and business value.
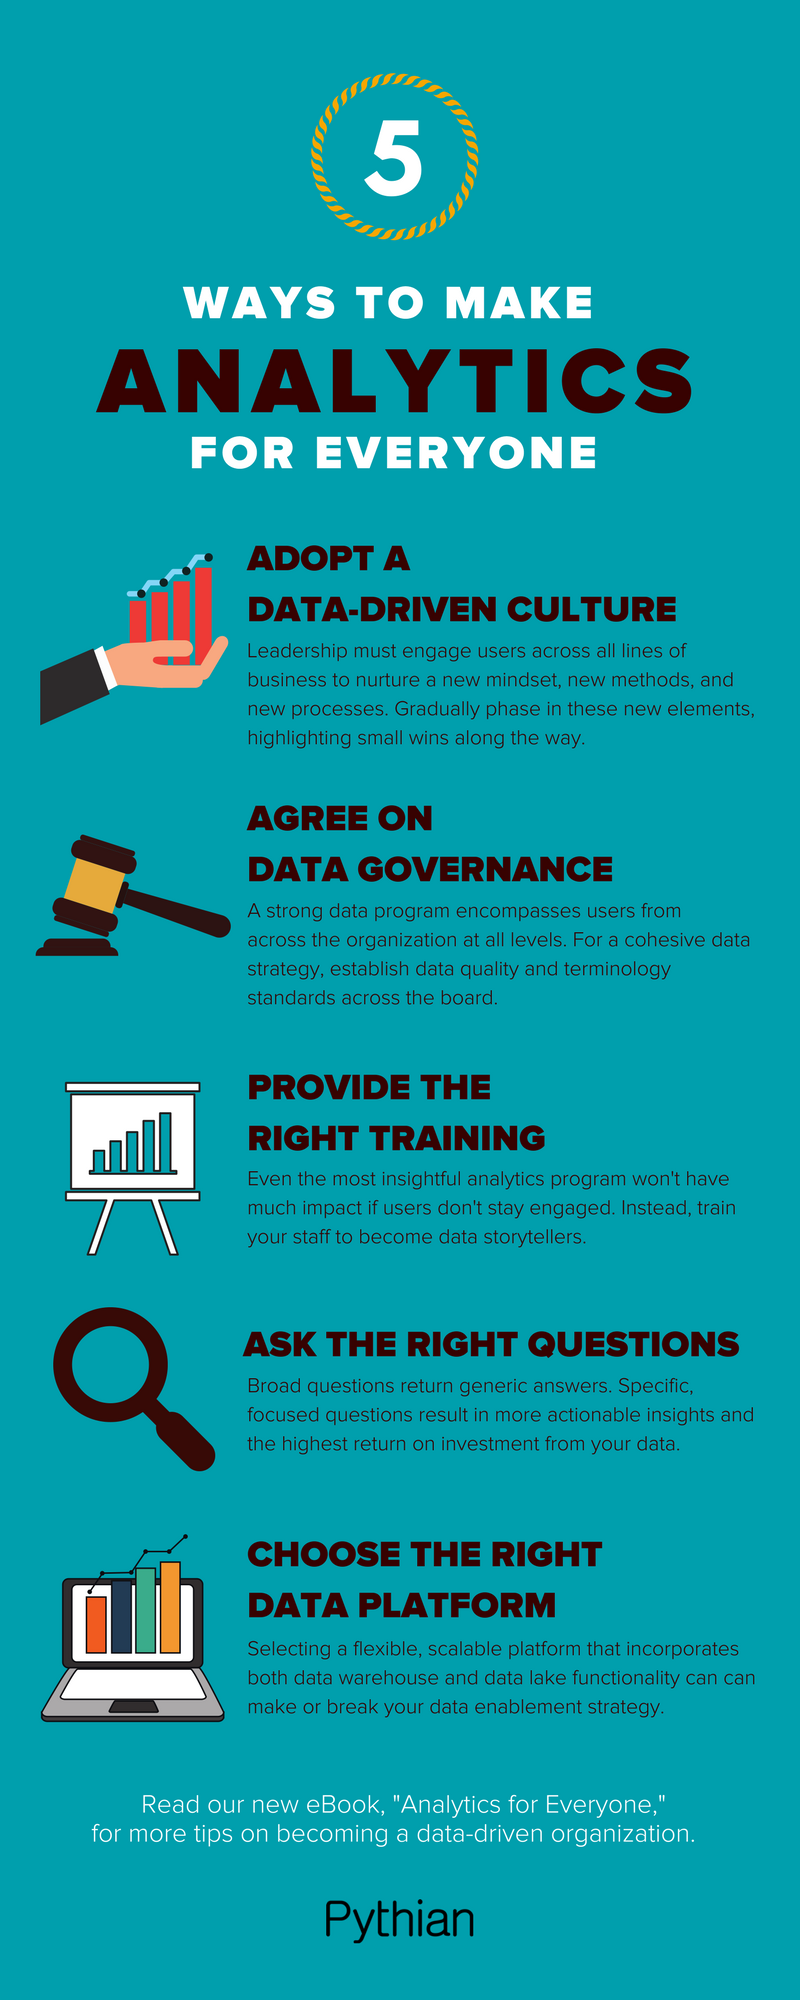
But before you jump into the deep end at your own organization, be sure to download our latest infographic highlighting the five pillars to a successful data program.
It shows that while putting analytics in the hands of more users at your business is crucial, what’s perhaps even more important is doing it right—and doing it right the first time.
View infographic in a new tab.
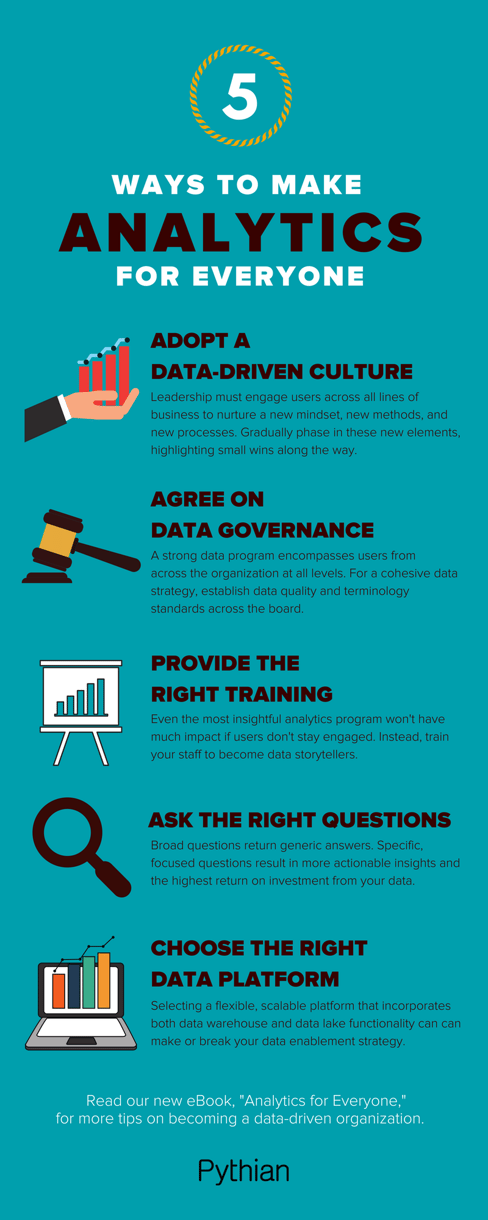
If you’re just getting started with building a data-driven culture in your organization, check out our latest eBook “Analytics for everyone” that provides tips for aligning your people and processes to become data-first, setting up your data governance and integration planning, training users and choosing the right data platform.


