A client asked us to verify why an INSERT AS SELECT statement, which was part of a scheduled ETL job executing on a single instance V11.2 database running as a data warehouse, suddenly started to take longer than usual. The database doesn’t have the Diagnostic and Tuning license, so Statspack and an external 3rd party application are being used to monitor the performance.
As a first step, this is what the wait profile of the SQL looked like:
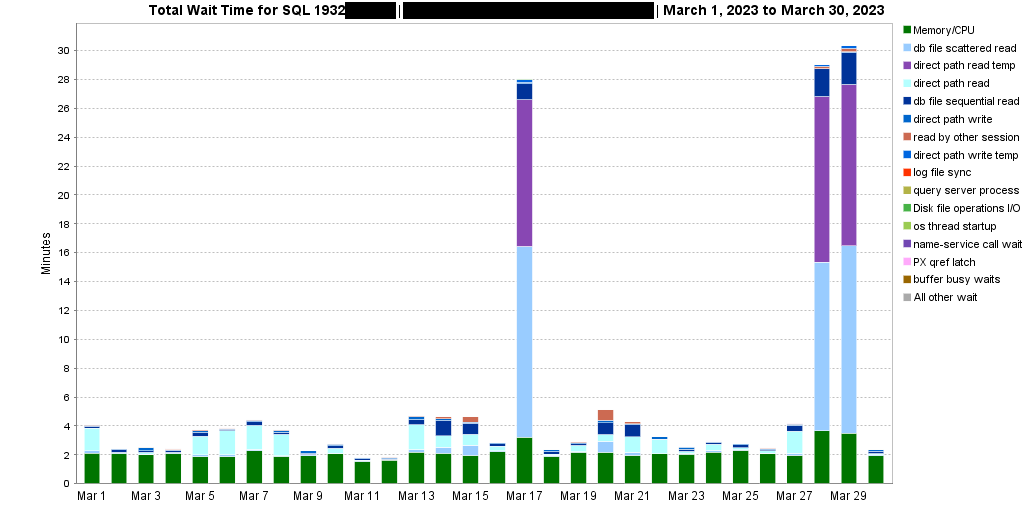
When the SQL was running slower, it spent most of its time accessing the TEMP tablespace (“direct path read temp” waits) and performing multiblock IO (“db file scattered read” waits). When the query executed faster, those waits were not present, and most of the SQL’s execution time was spent on the CPU. The execution plan of the SQL is not included as it’s not relevant to the illustration I’m trying to make. It contains HASH JOINs and WINDOW SORT operations that can spill to TEMP.
Searching for the root cause
Crosschecking data from Statspack and the external monitoring tool, I checked for the following:
- Was there a different execution plan being used when the query performed badly? No, there was only one plan throughout recorded history, so plan flipping was not the cause.
- Has the amount of data the query processes—or its contents—changed over time (which could explain why joins and/or sorts spilled to TEMP as the intermediate aggregated resultsets couldn’t fit into the allocated PGA)? The answer was no; the data in the underlying tables hadn’t changed significantly. Also, the amount of logical and physical reads and the number of rows the SQL processed per execution had not changed over time.
Looking for further clues in Statspack’s SQL statistics counters
Here are the Statspack’s performance counters related to the affected SQL (Note: at the time of writing this post, the text on the rightmost side was getting truncated because of a WordPress issue. In case it’s still happening, please open the excerpt in a new window):
SNAP_TIME       EXECUTIONS DISK_READS_PER_EXEC ROWS_PROCESSED_PER_EXEC ELAPSED_TIME_PER_EXEC SORTS_PER_EXEC PX_SERVERS_EXECUTIONS_PER_EXEC PARSE_CALLS_PER_EXEC DIRECT_WRITES_PER_EXEC CONCURRENCY_WAIT_TIME_PER_EXEC
--------------- ---------- ------------------- ----------------------- --------------------- -------------- ------------------------------ -------------------- ---------------------- ------------------------------
16-mar-23 04:00          0              617942                       0              332.9482              4                              0                    9                      0                         230346
17-mar-23 05:00          1             1121566                63912797             1685.4273              1                              0                    1                 412797                              0
18-mar-23 04:00          1             1092585               127846816              606.5164              4                              8                    8                  80257                          25764
19-mar-23 04:00          0              862719                       0              506.1391              4                              0                    9                      0                         634117
20-mar-23 04:00          0              608300                       0               882.194              4                              0                    9                      0                          11995
21-mar-23 04:00          1             1088442               127924804             1046.3832              4                              8                    9                  83255                         277674
22-mar-23 07:00          1             1062694               127946724              824.8674              4                              8                    9                  77812                          58507
23-mar-23 04:00          1             1088459               127968422              644.1335              4                              8                    9                  78066                         879125
25-mar-23 04:00          1             1090417               128014902              696.0783              4                              8                    9                  80087                         465698
26-mar-23 04:00          0              783875                       0               358.297              4                              0                    9                      0                         694610
27-mar-23 04:00          0              296686                       0              570.2624              4                              0                    9                      0                         402752
28-mar-23 05:00          1             1077697                64047434             1745.2112              1                              0                    1                 414732                             69
29-mar-23 05:00          1             1076876                64058926             1822.7275              1                              0                    1                 414916                             23
30-mar-23 04:00          1             1086441               128140708              589.5409              4                              8                    9                  80428                         658905
There are five rows with EXECUTIONS=0, so let’s not consider them for now. Focusing on the remaining ones, we can see that for the three problematic dates of the 17th, 28th, and 29th, there are indications of a possible downgrade in parallelism:
- “PX_SERVERS_EXECUTIONS_PER_EXEC”: “Total number of executions performed by parallel execution servers (0 when the statement has never been executed in parallel).” The SQL was executed serially on the problematic days, whereas it was assigned eight parallel servers on the other days. It seems there are some discrepancies on the 19th and 20th March. However, for those dates, the EXECUTIONS are also reported as 0, so this could be an instrumentation issue.
- “SORTS_PER_EXEC”: it’s reported as 1, whereas on other days, it’s 4. This could indicate that only one process was working on the INSERT (effectively running serially), whereas, on the other days, there were four.
- “CONCURRENCY_WAIT_TIME_PER_EXEC”: with fewer parallel processes, the wait for concurrency-related events significantly decreased.
- “PARSE_CALLS_PER_EXEC”: only one query parse vs. eight or nine query parses when the SQL ran quicker.
Additionally, the “Parallel operations downgraded to serial” statistic obtained from a one-hour Statspack snapshot showed 34 SQLs were downgraded around the time our problematic SQL was running, so this is a further indication that downgrades are occurring. Checking the “Servers Highwater” statistic in v$px_process_sysstat revealed that the maximum number of available parallel processes was reached since the instance was started, so another indication that leads into the direction of downgrades.
What’s the relation between TEMP usage and downgrades?
As PGA memory is allocated per process basis, a higher parallel degree means that the SQL effectively gets more memory assigned for its processing. Spilling intermediate sort/join operations to TEMP could thus be avoided when running with a high enough degree of parallelism, as the whole execution was done in memory, while when executed serially, this was not the case. Just for reference, WORKAREA_SIZE_POLICY was set to AUTO, not to MANUAL.
Parallel statement queuing on this database is not enabled (parallel_degree_policy=MANUAL and parallel_min_percent=0). This means that the degree of parallelism for a SQL can be silently downgraded to a lower degree, including serial execution, in cases where the requested amount of parallel processes is not available.
Was there a downgrade for this SQL? If yes, why it occurred?
The query’s parallel degree setting of all involved tables and indexes was set to 4. The INSERT should thus be running with a degree of parallelism 4, allocating eight parallel processes. The explanation of why eight parallel processes are allocated even though the parallel degree of the involved objects is four can be found here. As there was no historical performance data with enough granularity available (as mentioned, ASH is not available), I monitored the next live execution of the query.
Monitoring the status of all SQLs executing in parallel when our problematic SQL was also executing showed this:
SQL> @px
Show current Parallel Execution sessions in RAC cluster...

     QCSID QC_SID         QCINST_ID USERNAME   SQL_ID        SQL_CHILD_NUMBER     DEGREE REQ_DEGREE     SLAVES
---------- ------------- ---------- ---------- ------------- ---------------- ---------- ---------- ----------
      2902 2902,51855             1 APPUSER    0d1159k0k46k0                0         96         96        192
      1093 1093,33443             1 APPUSER    3cd08k0dxg63r                0         96         96        192
      1140 1140,56599             1 APPUSER    a6vjfy6s2t042                0         96         96        192
      2717 2717,33713             1 APPUSER    4vvs1f116caxw                0          8          8         16
      1660 1660,18139             1 APPUSER    1zrqrqjrytnyc                0          8          8         16
      1338 1338,17217             1 APPUSER    6vkdygctss81k                0          8         96         16
       966 966,49513              1 APPUSER    0ammd95tm1qxp                0          4          4          8 <<-- this is our query
Our query had a “fast run,” executing at the expected parallel degree of 4. However, notice the top three SQLs are running at a very high parallel degree. Summing up all of the parallel processes on the instance, there are 632. The init parameter parallel_max_servers, which specifies the maximum number of parallel execution processes and parallel recovery processes for an instance, was set to 640. This means that we’re very close to using all of the available parallel processes at our disposal.
The question of whether 640 parallel processes are a suitable value in this particular database is another discussion. Still, in this situation, any newly submitted parallel query will most likely be downgraded to a lower degree of parallelism or even to serial execution.
Putting all of the pieces of gathered evidence together
Considering all of the above, the most likely cause of our query running slower is that there were not enough parallel processes available, and thus it was downgraded to serial execution. Our query was thus a “victim,” and there’s nothing to fix. Instead, the focus has to be shifted to identifying why the above three SQLs were running with such a high parallel degree, effectively exhausting the pool of available parallel processes.
After analyzing the three SQLs, it turned out that there were two reasons for such a high parallel degree being used, and both were occurring at the same time:
1. Index DEGREE level
Even though the tables accessed by the SQL had their DEGREE set to 4, there was also a step in the execution plan accessing an index that had its DEGREE attribute set to DEFAULT. When an object has a DEFAULT degree of parallelism, Oracle computes the actual parallel degree as:
default_dop = cpu_count * parallel_threads_per_cpu * number_of_instances
This database has those parameters set as follows:
cpu_count=48
parallel_threads_per_cpu=2
num_instances = 1
So the actual computed parallel degree for the index is 48*2=96. When different degrees of parallelism are specified on the objects involved in a query (more specifically in every single data flow operation, which in this case was only one), Oracle usually chooses the highest of the specified degrees as the one to be used for the whole query. Given that Oracle uses two parallel sets of processes for all but the simplest SQLs, we can see why the SQLs used 2 * 96 = 192 parallel processes.
The DEFAULT degree was most probably unintentionally set by executing “ALTER INDEX SOME_INDEX PARALLEL;”, so without specifying an actual number for the degree. In our case the fix was to align the degree of parallelism to the same one already set at the table level: “ALTER INDEX SOME_INDEX PARALLEL 4;”. Another option could be to override the degree at the session level with “ALTER SESSION FORCE PARALLEL QUERY PARALLEL N“.
2. PARALLEL hint usage
One of the SQLs had the PARALLEL hint:
SELECT /*+ PARALLEL */ .. FROM ..
This SQL was also executed by 192 parallel processes, though not due to an index or table having their parallel degree set to DEFAULT, but because it contained the “/*+ PARALLEL */” hint. When this hint is used without specifying a parallel degree (e.g.,/*+ PARALLEL(4) */), Oracle behaves similarly as when it considers the DEFAULT degree of parallelism, so in our case it uses 192 parallel processes, if available. A possible fix is to either:
a) specify a parallel degree for the SQL, e.g.,/*+ PARALLEL(4) */
or
b) remove the PARALLEL hint altogether. Then let Oracle use the segments’ level DEGREE settings or override the parallel degree at the session level using “ALTER SESSION FORCE PARALLEL QUERY PARALLEL N“.
This issue is also a good candidate for fixing with Resource manager’s parallel statement queueing and degree limits. That would also prevent similar issues in the future when some segment has a wrong degree set.
Summary
This was an interesting and unusual investigation, as the problematic query behavior was actually the result of other queries exhausting the available resources. The two root causes were like a “perfect storm,” as they both depleted the parallel processes server pool in a very short time.

