Architecture diagram
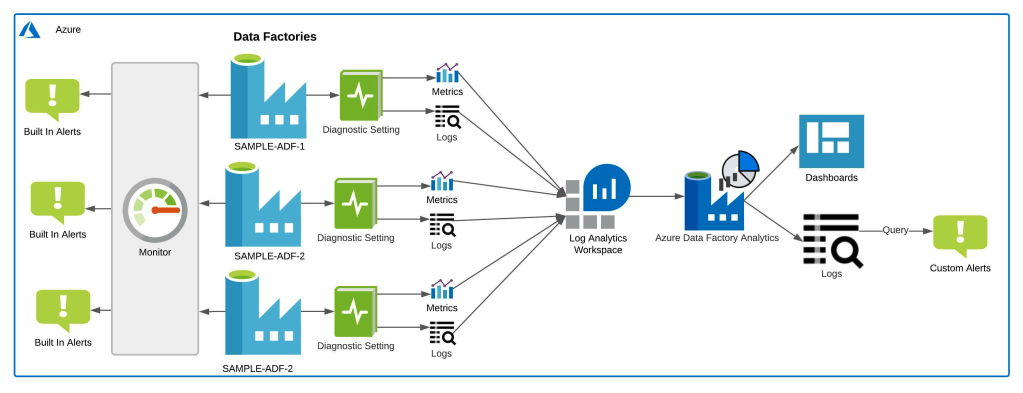
For effective monitoring of ADF pipelines, we are going to use Log Analytics, Azure Monitor and Azure Data Factory Analytics. The above illustration shows the architectural representation of the monitoring setup.
The details of setting up log analytics, alerts and Azure Data Factory Analytics are further discussed in this section.
Send to Log Analytics
Use the below PowerShell Script to enable diagnostics settings for your Data Factories to write to the Log Analytics Workspace. You can modify the log and/or metrics to be sent to Log Diagnostics in the below script. By default, it will collect all metrics and logs and sync it to the Log Analytics Workspace.
Note: If you want to set the destination table to resource-specific mode, you will have to update the setting in diagnostic settings. This script by default configures Log Analytics to write to the AzureDiagnostics Table. Because an Azure log table can’t have more than 500 columns, I would highly recommend you select resource-specific mode.
#functions for formatting and logging
function Write-Status ($message) {Write-Host ("[$(get-date -Format 'HH:mm:ss')] $message.").PadRight(75) -NoNewline -ForegroundColor Yellow }
function Update-Status ($status = "Success") {Write-Host "[$status]" -ForegroundColor Green}
function Exit-Fail ($message) {
	Write-Host "`nERROR: $message" -ForegroundColor Red
	Write-Host "Result:Failed." -ForegroundColor Red
	exit 0x1
}
function NoExit-Fail ($message) {
	Write-Host "`nERROR: $message" -ForegroundColor Red
	Write-Host "Result:Continue." -ForegroundColor Red
}

Add-AzureRmAccount

Import-Module AzureRM

#Replace <<placeholder>> with actual azure details
$subscription_id = "<<Your Subscription ID>>"
$datafactory_resourcegroup_name = "<<Resource Group Name where Data Factories are hosted>>" #Change the Resource Name if your Data Factories exists in separate RG
$log_analytics_workspace_name = "<<Resource Group Name for OMS>>"
$datafactory_name = "<<Data Factory 1>>", "<<Data Factory 2>>"
$workspace_name = "<<Log Analytics Workspace Name>>"

foreach ($df in $datafactory_name){
    ##Generate the Resource IDs
    $diagnostic_setting_name = "$($df)_logdiagnostics"
    $resource_id = "/subscriptions/$subscription_id/resourceGroups/$datafactory_resourcegroup_name/providers/Microsoft.DataFactory/factories/$df"
    $workspace_id = "/subscriptions/$subscription_id/resourcegroups/$log_analytics_workspace_name/providers/microsoft.operationalinsights/workspaces/$workspace_name"
    try{
        Write-Status "Enabling Log Diagnostics for $df ADF."
        Set-AzureRmDiagnosticSetting -Name $diagnostic_setting_name -ResourceId $resource_id -MetricCategory AllMetrics `
                                     -Categories ActivityRuns, PipelineRuns, TriggerRuns, SSISPackageEventMessages, SSISPackageExecutableStatistics, `
                                     SSISPackageEventMessageContext, SSISPackageExecutionComponentPhases, SSISPackageExecutionDataStatistics, `
                                     SSISIntegrationRuntimeLogs -Enabled $true -WorkspaceId $workspace_id -ErrorAction Stop | Out-Null
        Update-Status
    }
    catch{
        NoExit-Fail $_.Exception.Message
    }
}
Azure Data Factory Analytics solution
For monitoring and analyzing data factory pipelines, I recommend installing the Azure Data Factory Analytics solution from Azure Marketplace. This solution provides you a summary of the overall health of your Data Factory, with options to drill into details and to troubleshoot unexpected behavior patterns. Details on how to configure Azure Data Factory Analytics can be found here. As discussed in the previous section, ensure that you have the Log Analytics enabled. Azure Data Factory Analytics can help monitor cross-data factories. You can enable diagnostic settings for Data Factories and have them all write to one Log Analytics Workspace. When you create this service pack with that Log Analytics Workspace, it acts as your single pane for visualizing and analyzing all your data factories.
Azure Data Factory Analytics gives you a pre-built dashboard for all your data factories. This dashboard gives you detailed information like”
- Your Pipeline runs
- Your Activity runs
- Your Trigger runs
- Top 10 ADF errors
- ADF statistics
Customized Alerts: You can also explore the results on the dashboard, navigate to its Log Analytics query and create customized alerts on those queries.
You can also edit existing workbooks and create your own workbooks to create customized dashboards for Data Factories. At the time of this writing, the solution is in preview but still provides very useful historical information.
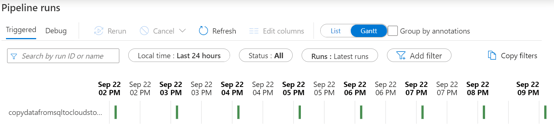
Monitor using the Gantt view
Within the Data Factory Studio, you can use Gantt views to quickly visualize your pipelines and activity runs:
You can find very useful information about job runtime when you hover over to one bars in the view:
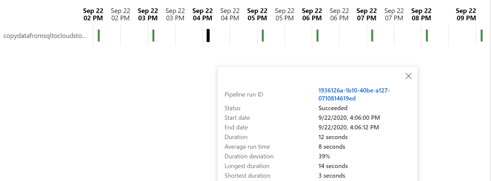
This will help you estimate the duration of the job and trace your activity times for the pipeline to further help tune your pipelines in ADF.
Setup ADF Alerts
I would recommend that you create the alerts on the following metrics to monitor ADF:
| S.No. | Metric Name | Aggregation Type | Threshold |
| 1. | Failed pipeline runs metrics | Total | Count of 1 |
| 2. | Failed trigger runs metrics | Total | Count of 1 |
| 3. | Integration runtime CPU utilization | Average | 80 Percent |
I have created some automation scripts to create these alerts with meaningful names and required parameters. The code can be found in this public Git repository.
Step-by-step approach to create ADF Alerts
- Open a command prompt and clone the repository:
git clone https://github.com/sa-proj/total-practice.git
- Navigate to <Git Repo Location>\total-practice\azure-datafactory-monitoring\ADF-Alerts\ Folder.
- Right click and edit ADFAlertDeploy.ps1 file. This should open the file in PowerShell ISE.
- Add your deployment location/region and resource group in the first two lines of the script:
$resource_group_name = "<<Enter the Resource Group Name to create the deployment>>"
$location = "<<Enter Azure Location>>"
$deployment_time = Get-Date -Format yyyyMMddHHmmss
$deployment_name = "adfdeployment" + "-" + $deploymentTime
$template_failedpipeline_file = (Get-Location).Path + "\" + "template.failedpipeline.json"
$template_failedtrigger_file = (Get-Location).Path + "\" + "template.failedtrigger.json"
$template_irhighcpu_file = (Get-Location).Path + "\" + "template.ircpuhigh.json"
$param_file = (Get-Location).Path + "\"  + "parameter.json"
New-AzureRmResourceGroupDeployment -Name $deployment_name -ResourceGroupName $resource_group_name -TemplateFile $template_failedpipeline_file -TemplateParameterFile $param_file
New-AzureRmResourceGroupDeployment -Name $deployment_name -ResourceGroupName $resource_group_name -TemplateFile $template_failedtrigger_file -TemplateParameterFile $param_file
New-AzureRmResourceGroupDeployment -Name $deployment_name -ResourceGroupName $resource_group_name -TemplateFile $template_irhighcpu_file -TemplateParameterFile $param_file
- Now navigate to the parameter.json file and update the Data Factory name and email address for the Action Group.
{
    "$schema": "https://schema.management.azure.com/schemas/2019-04-01/deploymentParameters.json#",
    "contentVersion": "1.0.0.0",
    "parameters": {
        "dataFactoryName": {
            "value":"ir-sandeep-arora-demo2"
        },
        "actionGroupName": {
            "value": "adf-alertActionGroup"
        },
        "actionGroupShortName": {
            "value": "adf-alerts"
        },
        "emailReceivers": {
            "value": [
                {
                    "name": "recipient name",
                    "emailAddress": "hello@sandeep-arora.com",
                    "useCommonAlertSchema": true
                }
            ]
        },
        "enableAlert": {
            "value": true
        }
    }
}
- Execute the ADFAlertDeploy.ps1 script, which will create the following:
- Action Group with name adf-alertActionGroup and short name adf-alerts. If you need to change the names, you can do so in the parameter.json file. (They are highlighted in purple in the code illustration above.) This Action Group will email when an alert is triggered.
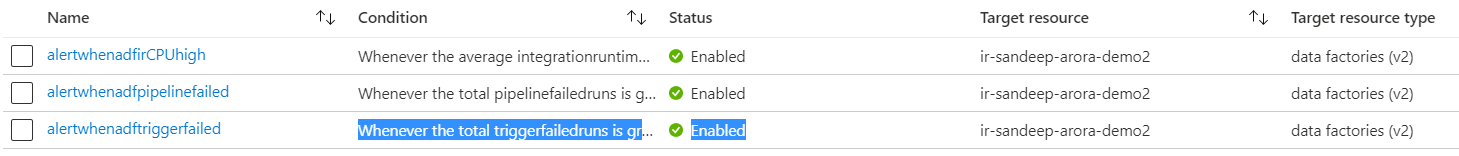
- Create three alerts in the specified Data Factory name.
| Name | Condition | Status |
| alertwhenadfirCPUhigh | Whenever the average integrationruntimecpupercentage is greater than 80 | Enabled |
| alertwhenadfpipelinefailed | Whenever the total pipelinefailedruns is greater than 1 | Enabled |
| alertwhenadftriggerfailed | Whenever the total triggerfailedruns is greater than 1 | Enabled |
- In order to create the same alerts for a different Data Factory, you will have to update the parameters file again with your Data Factory name and then submit the deployment again. This will create new alerts on that Data Factory.
The created alerts should appear under Data Factory Alerts, as seen below:
Self-hosted IR – custom dashboards
How do we know if there are some bottlenecks with self-hosted integration runtime (IR)? There are four metrics that can help you measure the performance or your hosted IRs:
- Average integration runtime CPU utilization – Average CPU utilization of nodes in IR. A threshold continuous breaching 80% mark indicates a serious CPU bottleneck.
- Average integration runtime available memory – Average memory available on the nodes. A lower value indicates memory congestion.
- Average integration runtime queue length – Average number of pipelines or activity runs in a queue. A higher count indicates IR resource congestion\bottleneck.
- Average integration runtime queue duration – Average amount of time the job waits before it gets scheduled. Higher values indicate congestion.
To understand the usage of these metrics, we need to set up a dashboard in Azure and explore them over a period of time. Use the sample dashboard here and import it into your Azure Portal Dashboards to monitor all these metrics in one place. To get started, download the JSON file from Git. Once downloaded, update the following placeholders using find and replace in the text editor:
- <<Subscription ID>> – Your Subscription ID
- <<Resource Group Name>> – Resource group name for the Data Factory
- <<Data Factory Name>> – Name of the Data Factory (only 1 is supported per dashboard)
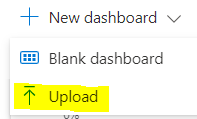
Once the file is updated, you can navigate to dashboards in Azure Portal:
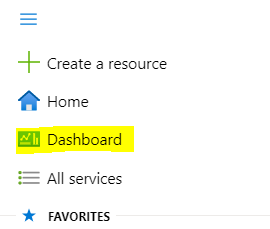
and upload the json file you updated in the previous step.
This should set up your ADF dashboard so you can monitor the metrics based on duration. This dashboard will help you understand if there are any bottlenecks in your ADF. Here is what the dashboard looks like when it’s been imported successfully:
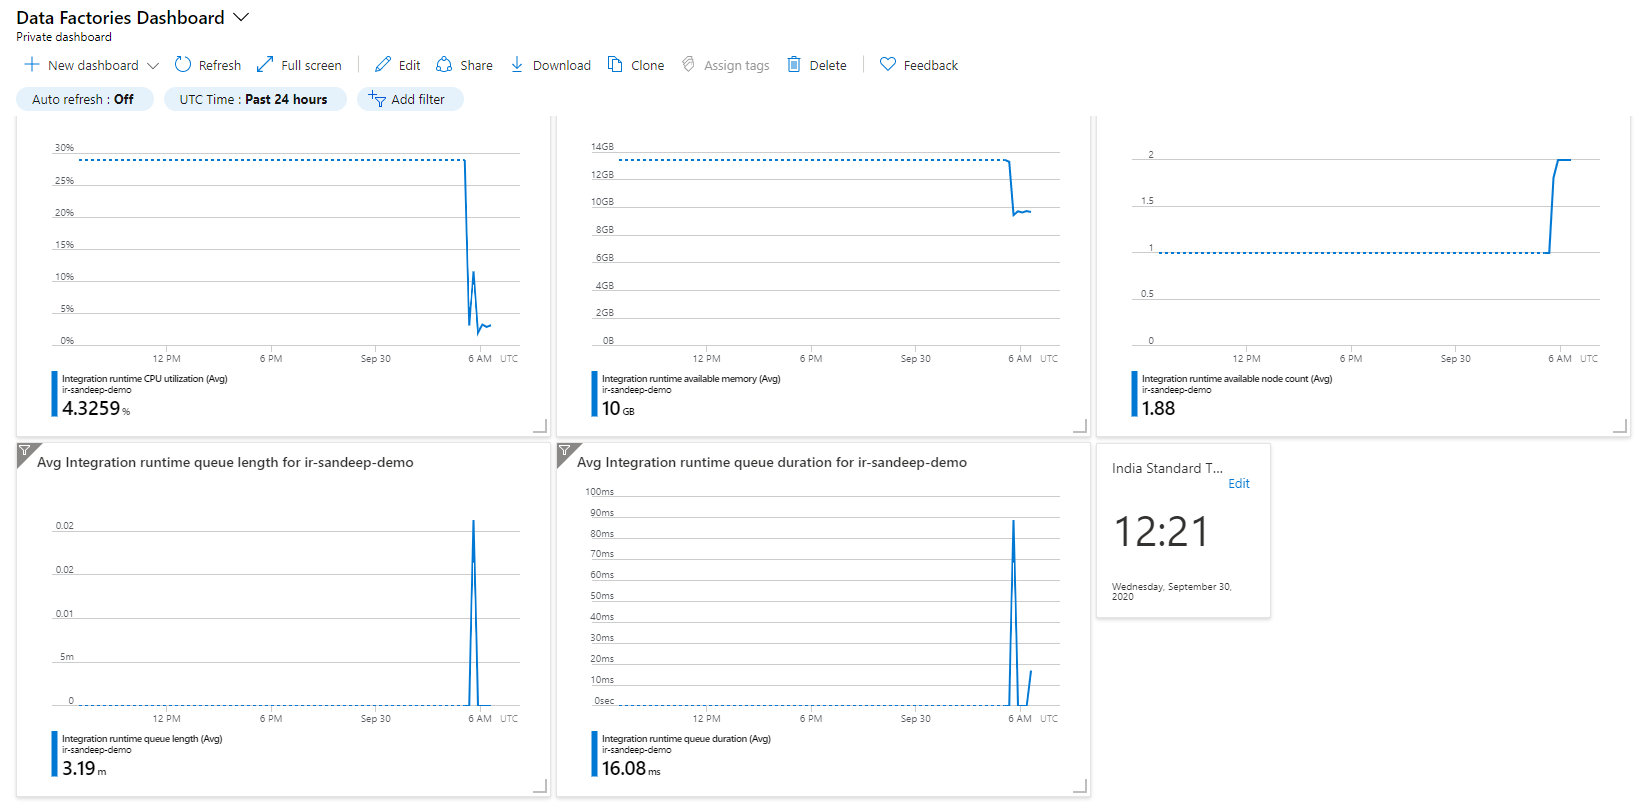
Note: For multiple Data Factories, you will need to create multiple dashboards. The dashboards use the Data Factory names for ease of identification.
Log Pipeline State to SQL Server database table
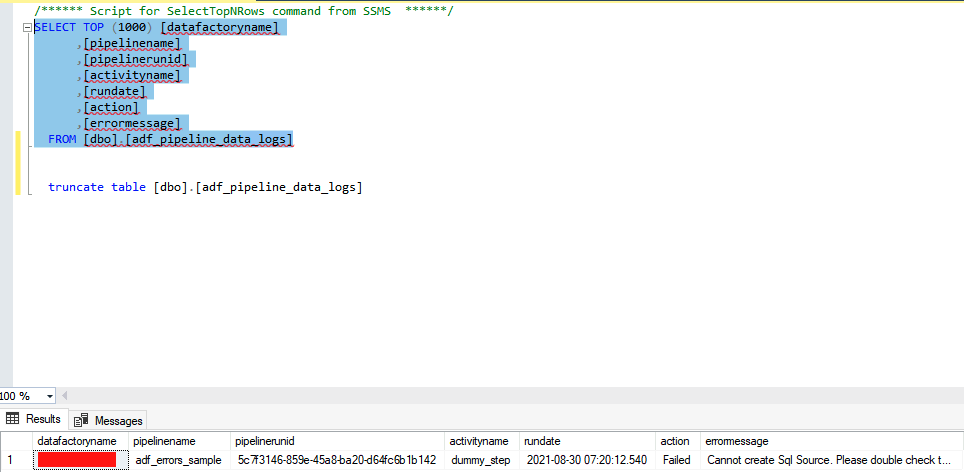
You will need the table schema and stored procedure to log the pipeline state to a custom table. Use the following SQL script to create the required database objects in your monitoring database:
/****** Object: Table [dbo].[pipeline_data_logs] Purpose: Table Schema to Store Pipeline Logs ******/
CREATE TABLE [dbo].[adf_pipeline_data_logs](
    [datafactoryname] [varchar](255) NULL,
    [pipelinename] [varchar](255) NULL,
	[pipelinerunid] [varchar](255) NULL,
	[activityname] [varchar](255) NULL,
	[rundate] [datetime] NULL,
	[action] [varchar](20) NULL,
    [errormessage] [varchar](1000) NULL
) ON [PRIMARY]
GO

/****** Object:  Stored Procedure [dbo].[usp_pipeline_data_logs]   Purpose: SP to be called from ADF to populate the table ******/
CREATE procedure [dbo].[usp_adf_pipeline_data_logs] (@datafactoryname varchar(255)
   @pipelinename varchar(255) ,
    @pipelinerunid varchar(255),
	@activityname varchar(255) ,
	@rundate datetime ,
	@action varchar(20),
    @errormessage varchar(1000))
AS
insert into full_dataload_logs values (@datafactoryname,
    @pipelinename,
    @pipelinerunid,
	@activityname,
	@rundate,
	@action,
    @errormessage)
GO
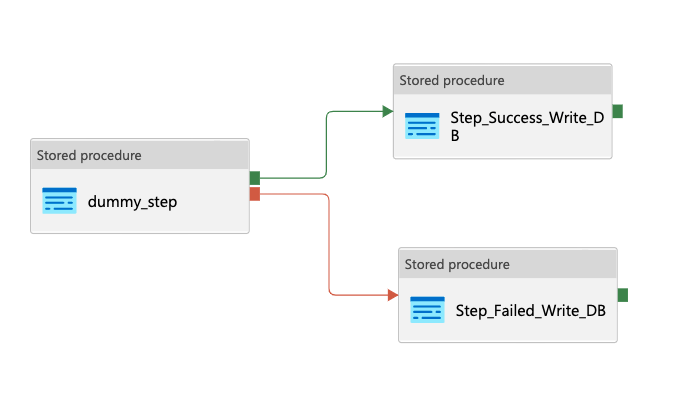
Now add failed and success steps to your pipeline for each activity as shown below:
- The step on the left is a dummy step to showcase how to append write logs steps to call the stored procedure and add logs to the database.
- If you only want the logs for error messages, you can skip the [Step_Success_Write_DB] step.
- For writing failure messages, make sure you select Change To: Failure for the arrow to the next step to be executed upon failure.
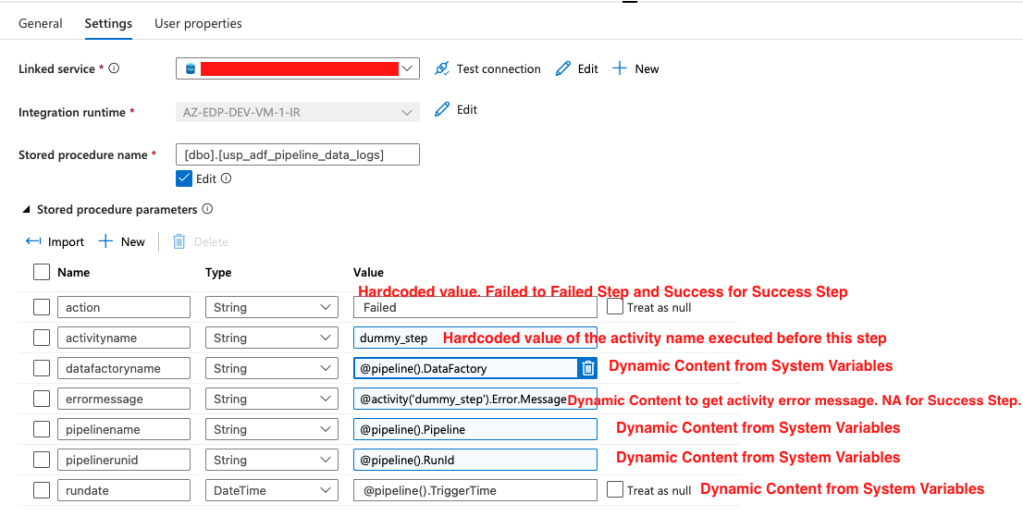
- See the settings below for the stored procedure that is called to write logs to DB and values to parameters passed to stored procedures:
- The import button under stored procedures parameters should bring in all parameters stored procedure is expecting.
- For Failed Step, hardcode “Failed” for action; for Success Step, hardcode “Success” for action.
- Make sure to update the activity name in the parameter. In my sample pipeline, the last activity name executed before this step was dummy_step.
- The errormessage parameter for success step will be hardcoded to NA because the step didn’t fail.
Note: You can add more columns and log more details, but these are the minimum you should log to track failure and success status for pipelines and their activities.
- After I debug the pipeline and let the step (dummy_step) fail on purpose, I can see the logs added to the table in SQL database:
Now you can monitor Azure Data Factory, self-hosted integration runtime environments and your ADF pipelines. Feel free to shoot me a message if you think I have missed something or if you can improve upon any of my suggestions for monitoring ADF.