Skip to content

Insight and analysis of technology and business strategy

OEM 13c Monitoring Features - Part 1

This is the first in a series of blog posts covering the most important topics you should know to completely monitor your IT infrastructure with Oracle Enterprise Manager Cloud Control 13c.   Oracle Enterprise Manager (OEM) offers solid monitoring capabilities with various built-in metrics, as well extended metrics, which allows OEM to monitor virtually anything, and gives the possibility of creating additional metrics using SQL (PL/SQL) or any type of server scripting language, like shell, MS-DOS batch files, etc.

Overview

To take advantage of OEM's monitoring tools, it's important to set it up according to your needs. In terms of basic monitoring, these are the most important items you'll have to go through to make sure you're properly monitoring your IT environment:
  • Target groups
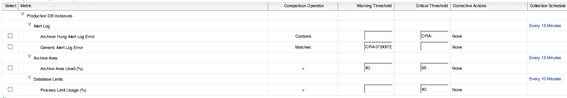
  • Metrics and thresholds
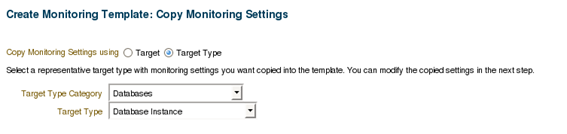
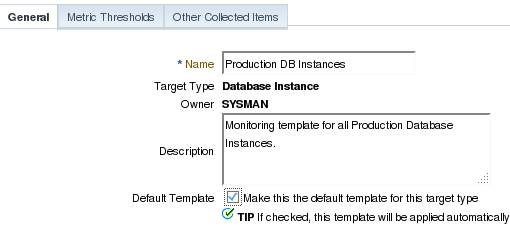
  • Monitoring templates
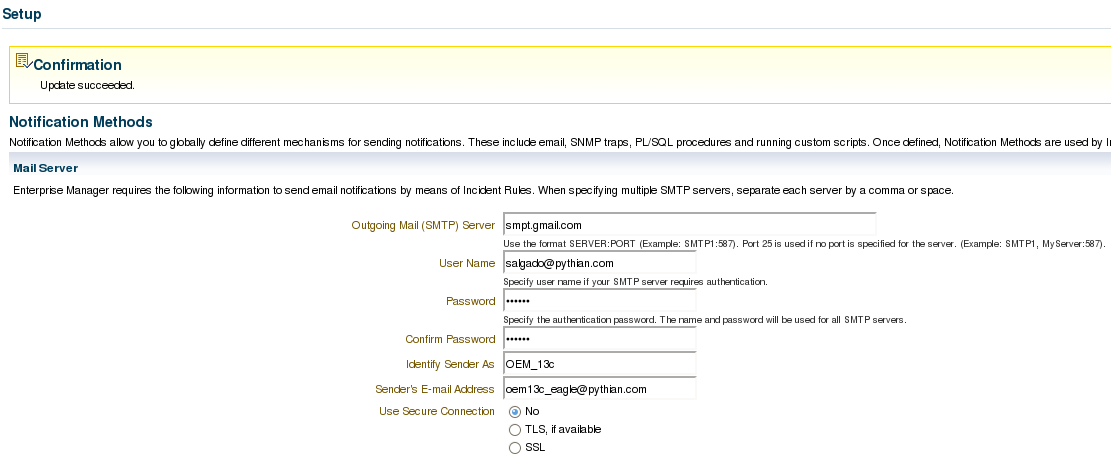
  • Notification methods
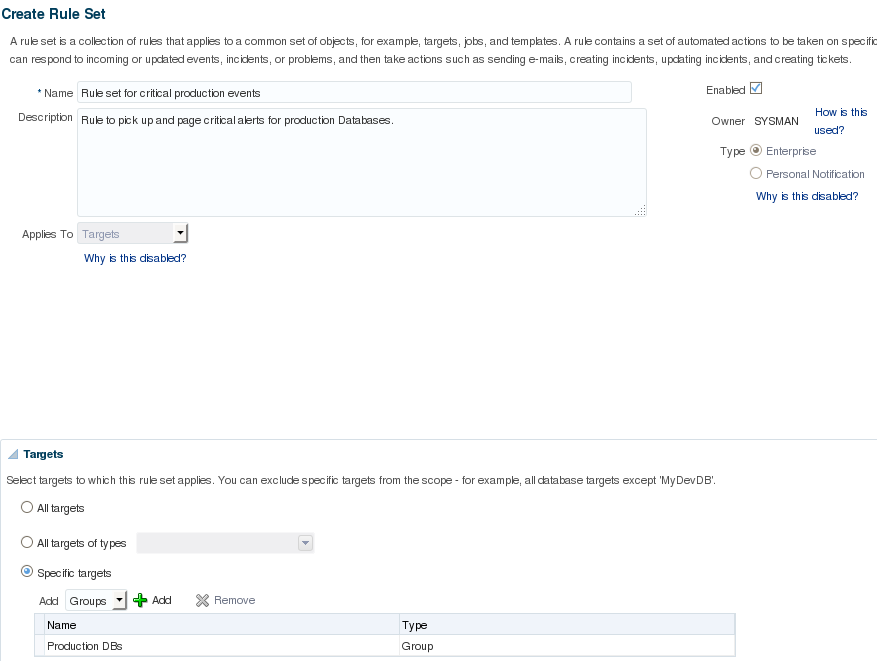
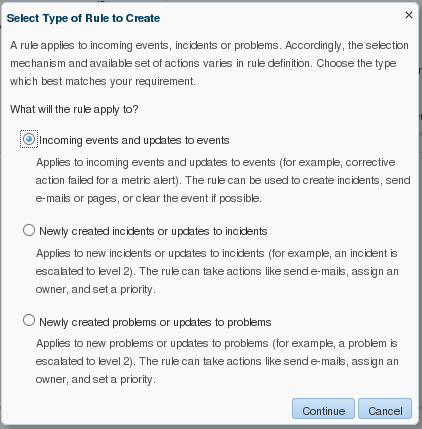
  • Incident rules
Below is the basic workflow for collected metrics. The Management Agent is responsible for collecting metrics and forwarding these details to the Oracle Management Server (OMS). When a metric reaches a threshold, OMS generates an event and passes it on to the “incident rules” for processing. These rules determine how each event should be treated and, if necessary, escalated.  

Basic monitoring features

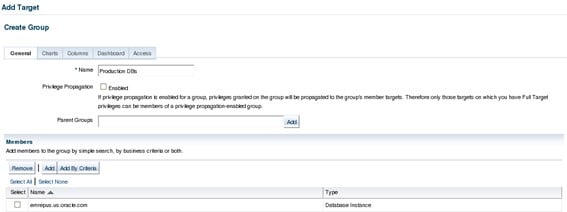
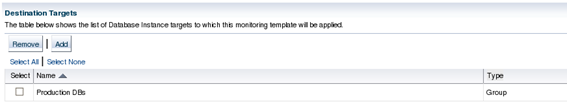
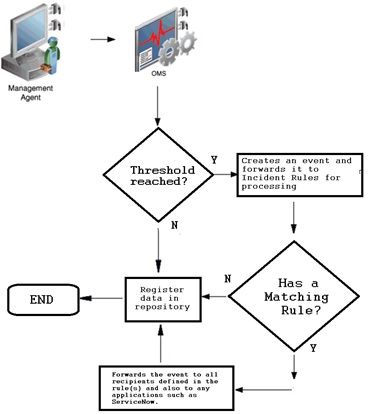
To send proper notification, OEM uses metrics thresholds and incident rules. To properly monitor the IT environment with OEM, it's important to carefully select which metrics should be collected and on which targets. The best way to achieve this is by setting up different target groups and monitoring templates. Depending on the needs of each target, there's usually a group for production targets: one for development, and so on. But groups may be created based on other criteria such as database sizes, serviced applications, etc. Groups can be created on "Targets -> Groups" page:

Above is an example of a group with only one DB in it, but each group may contain as many targets as needed. The next step is to define which metrics will be collected and the thresholds for each one. This may be done individually for each target, but it's a lot easier to do so using monitoring templates, which are templates that store which metrics should be collected and their thresholds. Once saved, a template can be easily pushed to one or many targets as well as to groups of targets. The example below shows the creation of a monitoring template for production databases. Templates can be created thru "Enterprise -> Monitoring -> Monitoring Templates":

On the next screen, specify a template name and description.

The most important part when creating a template is the selection of metrics that should be collected and monitored. Initially, Oracle brings up all the default ones, which can be manually removed. There are also some less-used metrics that can be added to the template. The same thing goes for extended metrics (which will be covered later in this series). Once those are created, they can be added to templates and then easily pushed to all DBs within a group, for example. Below I’ll select only a few metrics as example and defined a threshold for each one. Note: Metrics that don't have a threshold will not raise alerts.

Once the template is created, push it to the desired targets by selecting the template and clicking on the “Apply” button. There are two options when applying a template: 1 - Completely override all existing metrics on the target, thus keeping only the metrics included in the template or 2 - Update only metrics that are common to both the template and the target(s).

The below example shows how to apply the template to the "Production DBs" groups so the template will be applied to all the members of the group:

Once the metrics and thresholds have been set, OEM will start to collect data for these metrics at the specified intervals. Whenever the returned data reaches a threshold, OEM raises an event. These events are picked up by incident rules, which will determine how they should be handled. These rules make use of the notification methods defined within OEM, so we need to set up notifications before defining incident rules. Go to “Setup -> Notification -> Notification Methods”.

The most basic notification method are e-mails. Include the mail server details in order to be able to send e-mails directly from OEM, which also supports scripts and SNMP traps as notifications. Select the desired notification type(s) and click on “Go”. Last, but not least, set up how OEM should treat the events that will be raised whenever a metric reaches a threshold using the incident rules. This is accessible through “Setup -> Incidents -> Incident Rules”. There are some default system-generated incident rules which will raise alerts for anything, so it’s usually preferable to disable the existing ones and create new ones to handle the events. First, define the name for the rule set and to which target should these rules be applied. Consider creating one group per target type. Once the rule is set per group, it should make it easier to maintain a healthy monitoring thru OEM:

After defining the basic details for the rule set, create some actual rules. Rules can be added by clicking the “Create” button on the “Rules” area:

Choose which metrics will be part of this specific rule. Since this is intended as a paging rule, it’ll only pick up events that reached the “critical” threshold. For events that reached the “warning” threshold, a separate rule will be created to handle such events and notification only by e-mail, without sending a page.

Next, determine which actions should be taken when such an event occurs. Set the "paging rule" to send a page as well as an e-mail. It’s also possible to select SNMP traps (this topic will be covered later in this series) and script traps to be executed when an event occurs.

By checking the "Clear event permanently", this event will be permanently cleared, thus it will not be picked up by another "Rule Set" further down the line. This is what the rule will look like:

It will pick up any critical events for the “Archiver Hung Alert Log Error”, “Process Limit Usage (%)”, and “Generic Alert Log Error” metrics. Whenever these events occur, it will forward a message to the administrator and page to the SYSMAN user. Note: Rule sets are evaluated following a predefined order, so when a new event is raised, it will be treated by the first rule set with matching conditions. The same event may be picked up by more than one rule. In order to prevent this from happening, we must check the “Clear permanently” checkbox, otherwise the event may be picked up by another rule set down in the processing line. Rule sets can be created to pick up any events coming from determined target types or only selected events. To make full use of OEM monitoring capabilities and to allow easier maintenance, it’s preferable to explicitly select events that are to be treated by each rule set, and create a generic rule set to pick up all remaining events and forward it by e-mail. That way, OEM will be able to correctly treat the events we need to be aware of and, for all the other events, an e-mail will be sent which will make it easier to identify the ones that are not being treated properly. Such generic rules should be placed at the end of the incident rules processing line. Below is one example of a generic rule to forward by e-mail any events that were not treated, and cleared, by previous more specific rules:  

There are several different ways to organize incident rules: by groups, by severity, by metric, etc. Each company has different needs, so choose the one that best suits your needs. Fine-tuning a monitoring system is a complex and time-consuming task. To enssure proper monitoring of all required events without generating excessive noise, a good starting point is to use incident rules to treat WARNING and CRITICAL events separately. Stay tuned for the next blog post which will cover how OEM's monitoring capabilities can be significantly extended with the use of Extended Metrics.

Top Categories

  • There are no suggestions because the search field is empty.

Tell us how we can help!

dba-cloud-services
Upcoming-Events-banner