This is the third in a series of blog posts covering the most important topics you should know to completely monitor your IT infrastructure with Oracle Enterprise Manager Cloud Control 13c. The previous posts covered how to set up basic monitoring and how to use extended metrics.
As mentioned in the previous post, historical data collection can be kept in the Oracle Enterprise Manager (OEM) repository for reporting purposes, depending on the metric settings. Such reports can be created and automated directly thru OEM by using the “Information Publisher Reports” and the “MGMT” views existing inside the OEM repository database.
Oracle provides a set of monitoring views (MGMT$) which allows us to query data for all collected metrics against all monitored targets. This permits the creation of business-related metrics which can be used for alerting purposes as seen previously, as well as providing the basis for business health monitoring reports.
The data collected by the “PENDING_CALLS” metric created previously can be used to generate a report displaying the number of pending calls over time, providing information useful to identify trends and acting to prevent calls from taking too long to be completed. This is something that would be hard to achieve using only the alerting features of the extended metrics.
The tables used by this report are : MGMT$METRIC_DAILY and MGMT$METRIC_DETAILS, both owned by 'SYSMAN'.
The difference between these two tables is that MGMT$METRIC_DAILY only displays the past 24 hours of data, so it’s a smaller set of data and is usually quicker than MGMT$METRIC_DETAILS, which contains the whole history of all metrics gathered against all monitored targets. Data displayed in the “DAILY” view reflects data that existed at the time the base tables were refreshed. That’s why this table has a “ROLLUP_TIMESTAMP”, instead of a “COLLECTION_TIMESTAMP” column.
Main Columns:
COLLECTION_TIMESTAMP / ROLLUP_TIMESTAMP: Shows timestamp of metric collection.
TARGET_NAME: Name of the target on which the metric was collected.
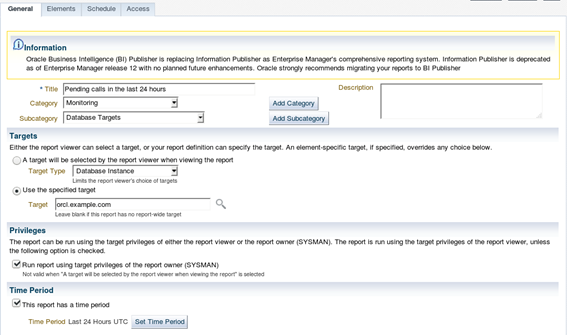
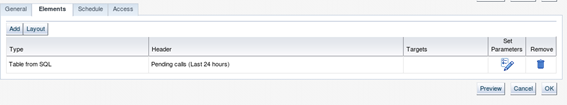
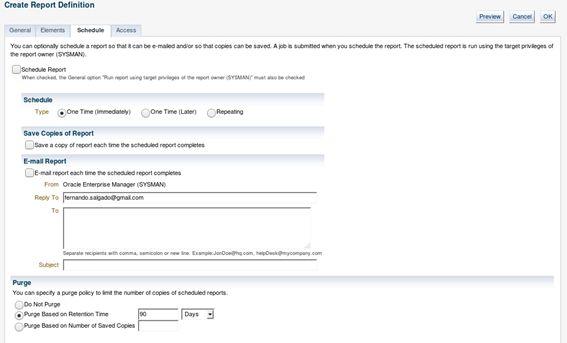
Go to “Enterprise -> Reports -> Information Publisher Reports” and create a new report with the following settings:
Below is an example of the actual report:
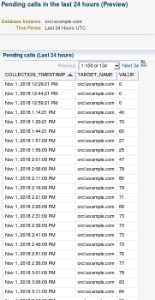
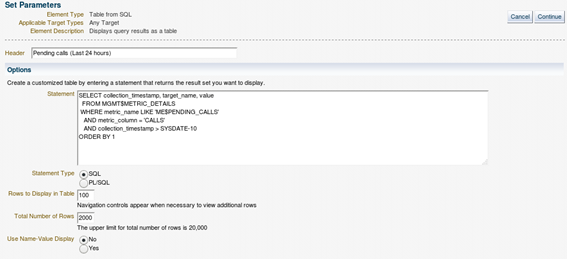
And here is the query used in the report:
SELECT collection_timestamp, target_name, value
  FROM mgmt$metric_details
  WHERE metric_name = ’ME$PENDING_CALLS’
  AND metric_column = ‘CALLS’
  AND collection_timestamp > SYSDATE-10
 ORDER BY 1;
Stay tuned for the next blog post which will cover Corrective Actions.

