If you have a New Relic Infrastructure Pro license, and unmonitored MySQL servers, there's now an easy solution at your fingertips. With the New Relic MySQL integration you can monitor and graph almost any detailed metric you could possibly want. New Relic recently unified its analytics tools with New Relic One, a dashboard that provides quick access to all the New Relic tools. With an Infrastructure Pro subscription, you get access to:
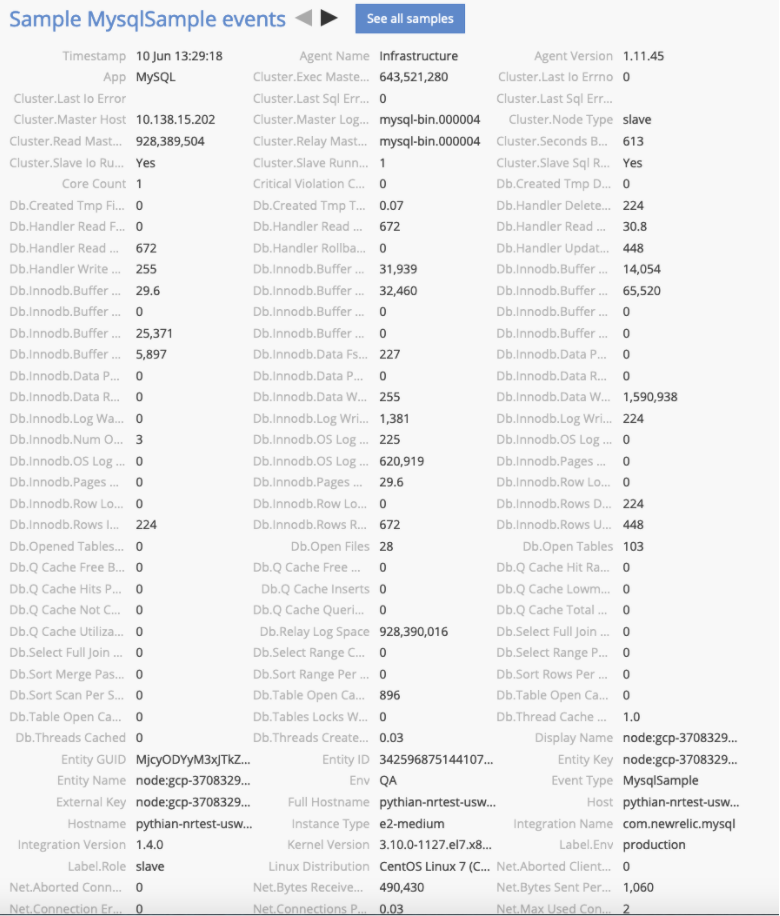
 Now we're ready to create alerts on any conditions / data New Relic collects. With the MySQL integration we have a large choice of metrics to choose from:
 For our setup we are going to create a simple alert that will notify us whenever replication is stopped. In order to set up alerting, you need to create a new notification channel. To set up a notification channel, click on the alerts menu item. Next, pick the “Notifications channels” tab on the alerts page.
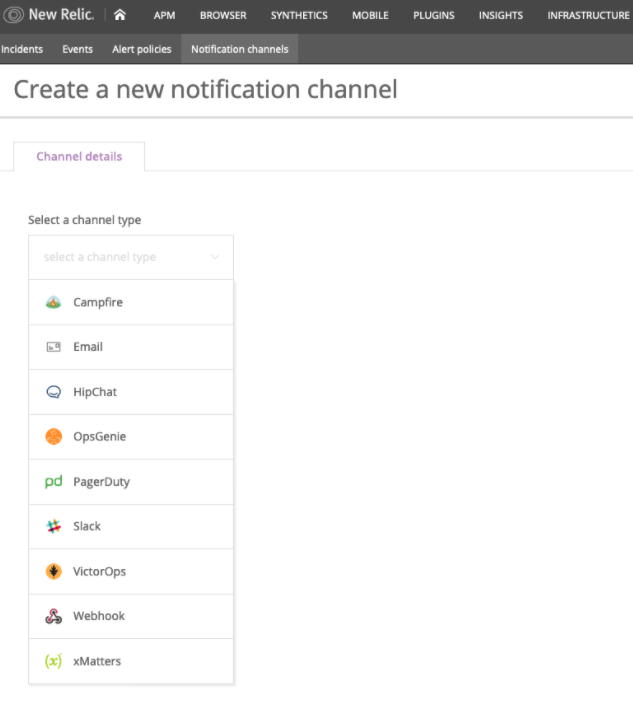 New Relic Alerts provides a nice selection of notification channels / integrations for alerting including Slack, PagerDuty, OpsGenie, XMatters and, of course, email. Once you have a notification channel set up, you can create a channel policy for receiving notifications:
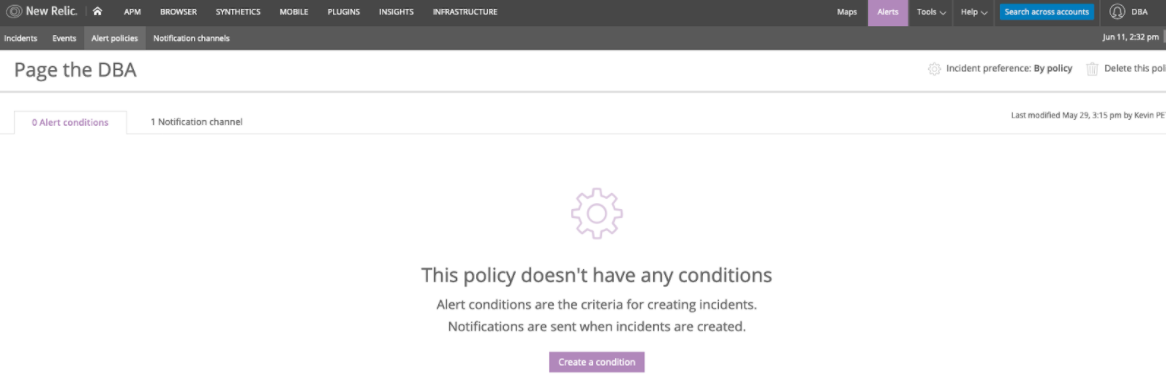
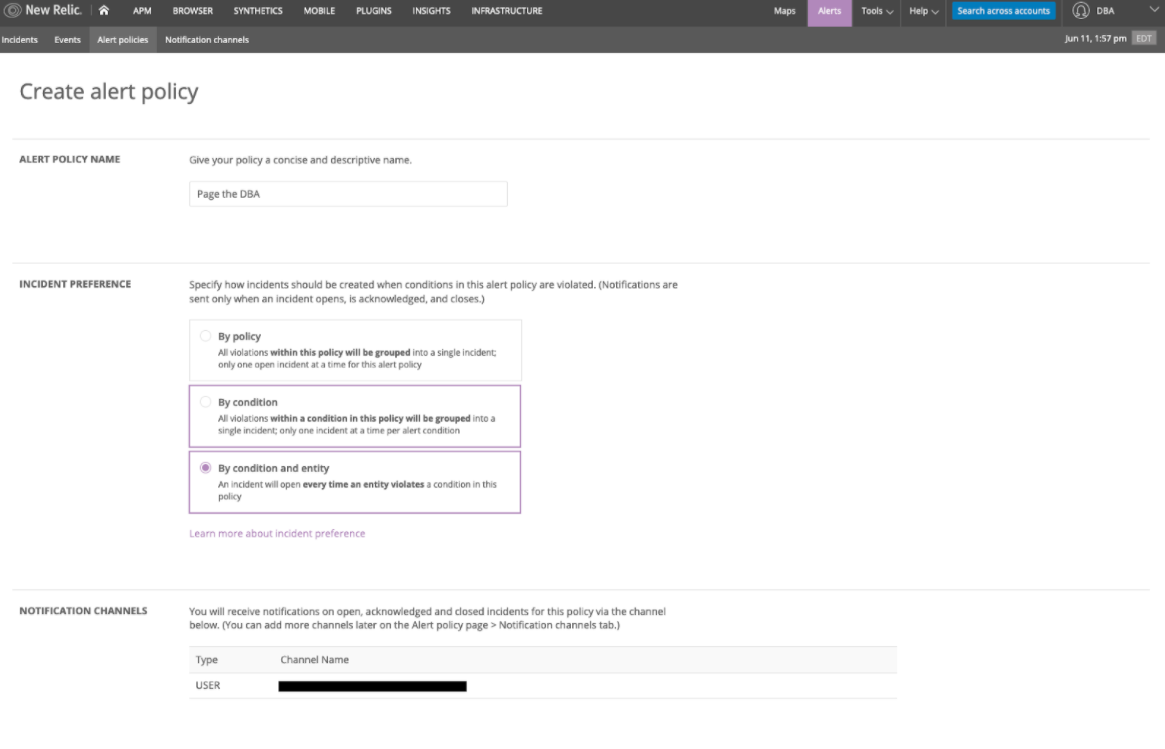 Once you have a notification channel and policy defined you can start creating alert conditions:
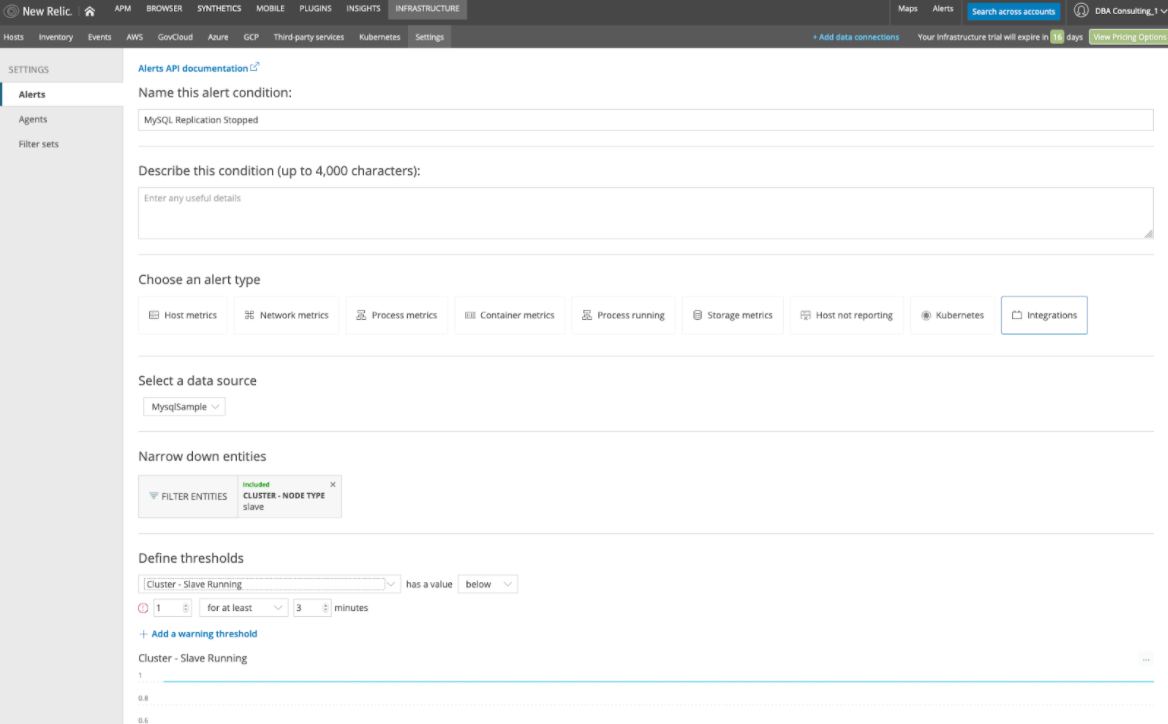
 Below you can see I picked the “Integrations” alert type to get the list of MySQL metrics. I then chose the “MySQLSample” and narrowed the scope to MySQL servers with the “cluster - node type” of slave. This will enable this alert on all New Relic hosts set up with the MySQL integration that are slave members using replication.
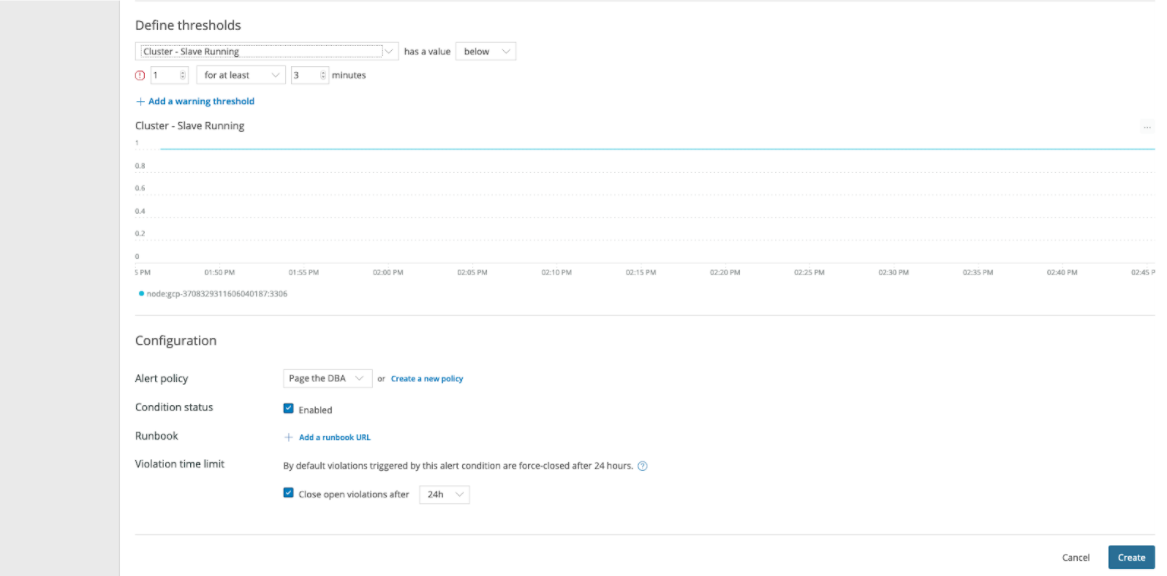
 We define the measurement threshold for the metric. In this case it's always "1" when replication is running and "0" when it’s stopped. We also choose the alert policy / notification channel, then click “create.”
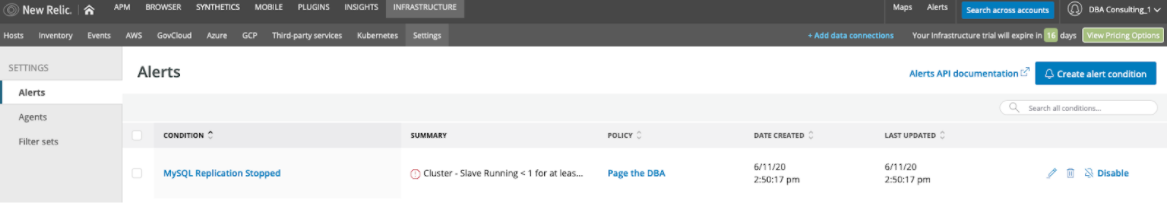
 And we have created our first alert.
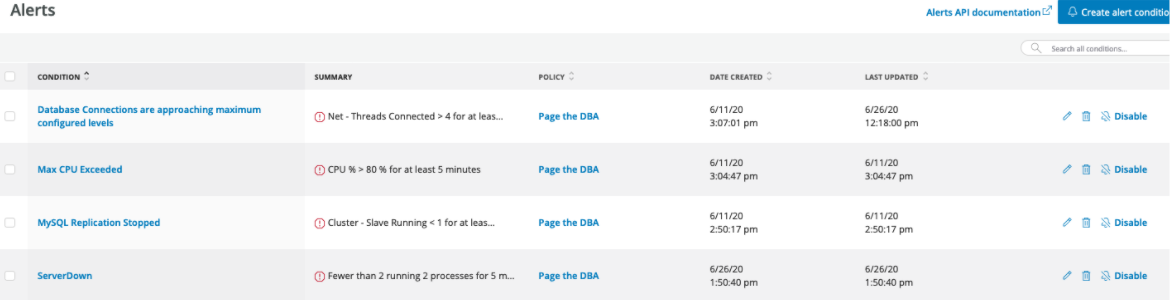
 It's important to make sure you're targeting the proper servers for each alert. In our example above, for the “narrow down entities” option, we indirectly targeted only MySQL DB Servers by choosing a metric that only MySQL instances will send to our New Relic account. That’s great for this metric, but as the DBA (database administrator) we don’t want to get paged for anything other than the database hosts and database server issues. One way we can narrow down entities is via tags or other attributes. To ensure you are only monitoring the hosts you are targeting it's a best practice to use tags generously in your infrastructure deployment code and leverage them in “narrow down entities” for precise monitor targeting. For monitoring the “MySQL Server Down” condition, we'll use the general host level metrics and leverage the process information to alert only when we see a count of zero /usr/sbin/mysqld processes. With a few more clicks I have now added MySQL database server alerts for excessive CPU conditions, max_connections or MySQL Server failures:
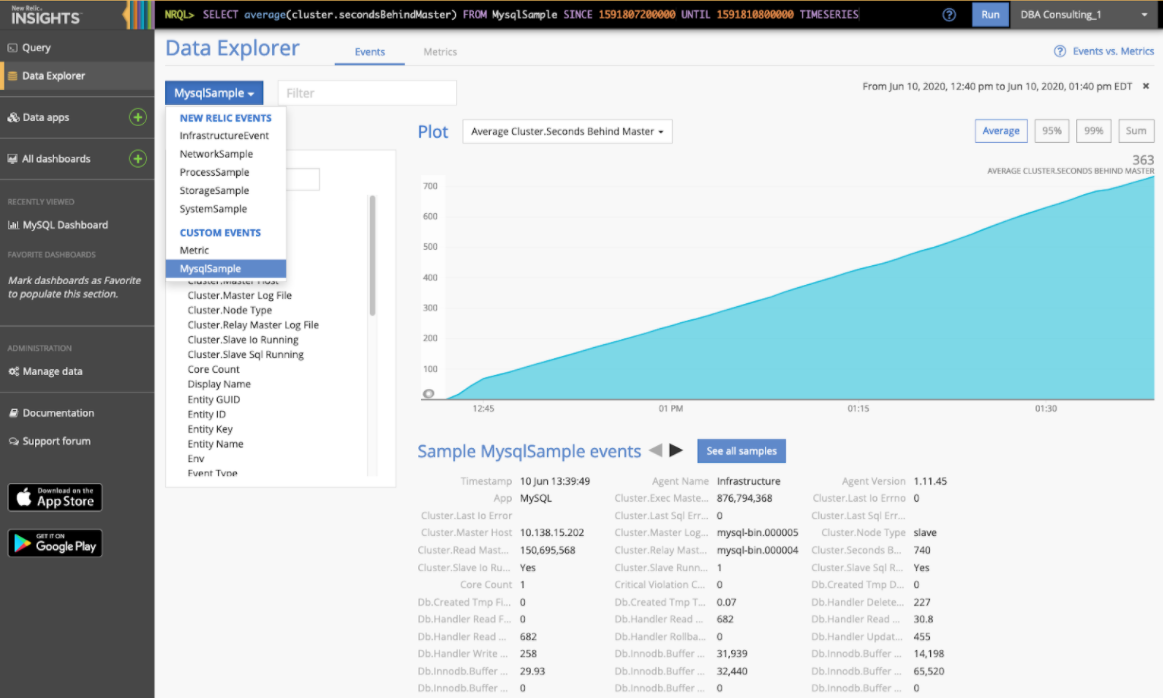
 Another way to explore these metrics is to use the Data Explorer which is part of “New Relic Insights” and can be found as a tab in New Relic Infrastructure. Data Explorer lets you list / graph individual metrics and build alerts if desired. Below you can see I was examining the metric “Avg Cluster.Seconds Behind Master”:
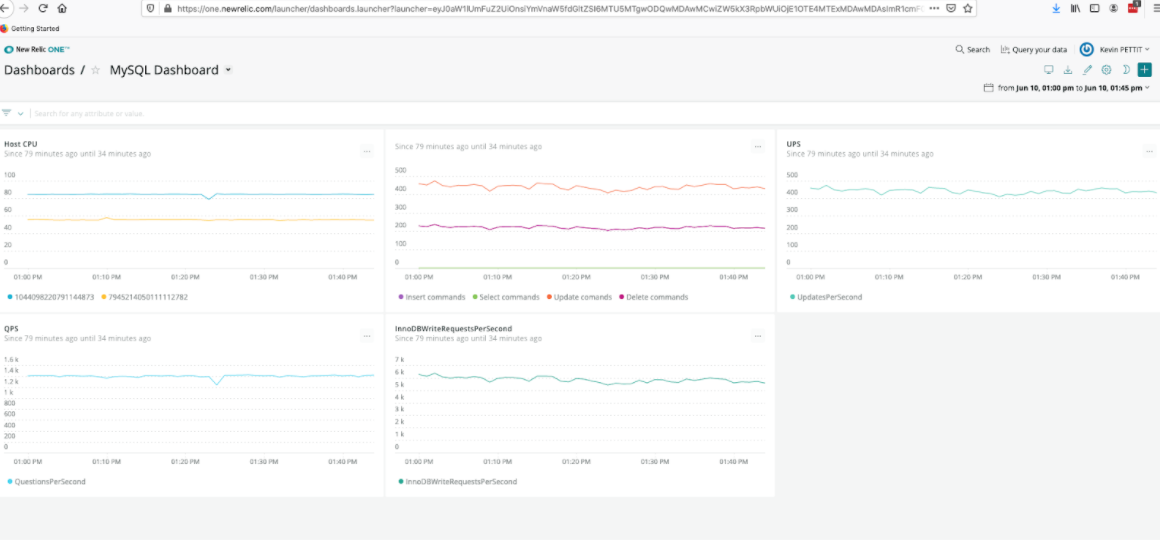
 With Insights and its tools you can explore your data and create custom dashboards:
 Hopefully this post has provided you with a helpful overview of the type of MySQL alerting and monitoring you can set up using New Relic Infrastructure.
- New Relic Infrastructure: Flexible, dynamic monitoring of your entire infrastructure, from services running in the cloud or on dedicated hosts, to containers running in orchestrated environments.
- New Relic Alerts: A flexible, centralized notification system that unlocks the operational potential of New Relic. Alerts is a single tool to manage alert policies and alert conditions for all of your New Relic data.
- New Relic Logs: A fast, scalable log management platform that allows you to connect your log data with the rest of your telemetry data.
- New Relic Insights: Allows you to query and chart your New Relic data. Insights is a software analytics resource for gathering and visualizing data about your software, and understanding what that data says about your business.
New Relic infrastructure agent install
New Relic provides a nice wizard page that generates the commands needed to install the infrastructure agent and configure it for your account. For our target OS (CentOS 7) the wizard generated the following commands for installation:# Create a configuration file and add your license key echo "license_key: xxxxxxxxxxxxxxxxxxxxxx" | sudo tee -a /etc/newrelic-infra.yml && # Create the agent’s yum repository sudo curl -o /etc/yum.repos.d/newrelic-infra.repo https://download.newrelic.com/infrastructure_agent/linux/yum/el/7/x86_64/newrelic-infra.repo && # Update your yum cache sudo yum -q makecache -y --disablerepo='*' --enablerepo='newrelic-infra' && # Run the installation script sudo yum install newrelic-infra -yOnce you run the above commands, the infrastructure agent will begin sending OS metric data to New Relic ( Note: We are making the assumption that you've already set up any firewalls needed for the New Relic infrastructure agent). If you want a custom name for your host (Default is hostname) you can add "display_name: Name" to the /etc/newrelic-infra.yml file. You can add tags as custom_attributes and can use them to describe the host's function. All of the configuration options can be found here and below is a sample /etc/newrelic-infra.yml file using the display_name and custom_attributes options:
license_key: 1db211983ab4871600faef016f5235066f208fd5
 display_name: mysql-qa-usw-a-1
 verbose: 0
 custom_attributes:
  env: QA
  app: MySQL
  team: Pythian
This takes care of getting the host level metrics into New Relic, but we really want to collect MySQL metrics so we can be alerted for specific database problems. To collect MySQL metrics, we need to install the MySQL integration and have an Infrastructure Pro account. The Link to the MySQL integration provides these simple instructions for installation:
sudo yum -q makecache -y --disablerepo='*' --enablerepo='newrelic-infra'
 sudo yum install nri-mysql
The above commands will install the MySQL integration on my CentOS 7 hosts but we will still need to set up a MySQL user and customize the MySQL integrations configuration file before we start collecting MySQL data. Using the MySQL command line, create a user with replication privileges :
mysql> CREATE USER 'newrelic'@'localhost' IDENTIFIED BY 'YOUR_SELECTED_PASSWORD';

 mysql> GRANT REPLICATION CLIENT ON *.* TO 'newrelic'@'localhost' WITH MAX_USER_CONNECTIONS 5
Change the directory to the integration's folder and copy the sample configuration file:
# Change the directory to the integration's folder.
 cd /etc/newrelic-infra/integrations.d
 # Copy the sample configuration file:
 sudo cp mysql-config.yml.sample mysql-config.yml
 # Edit the file mysql-config.yml as shown below substituting the hostname, user, password:
 vi /etc/newrelic-infra/integrations.d/mysql-config.yml
integration_name: com.newrelic.mysql
 instances:
  - name: mysql-server
  command: status
  arguments:
   hostname: localhost
   port: 3306
   username: newrelic
   password: xxxxxxxxxxx
   extended_metrics: 1
   extended_innodb_metrics : 1
   # New users should leave this property as `true`, to identify the
   # monitored entities as `remote`. Setting this property to `false` (the
   # default value) is deprecated and will be removed soon, disallowing
   # entities that are identified as `local`.
   # Please check the documentation to get more information about local
   # versus remote entities:
   # https://github.com/newrelic/infra-integrations-sdk/blob/master/docs/entity-definition.md
   remote_monitoring: true
  labels:
   env: production
   role: Master
Note, in the above configuration file we have enabled both extended_metrics and extended_innodb_metrics for MySQL. The complete list of the MySQL metrics is quite extensive, and custom graphs and alerts can be created for any of them. The next step is to restart the infrastructure agent:
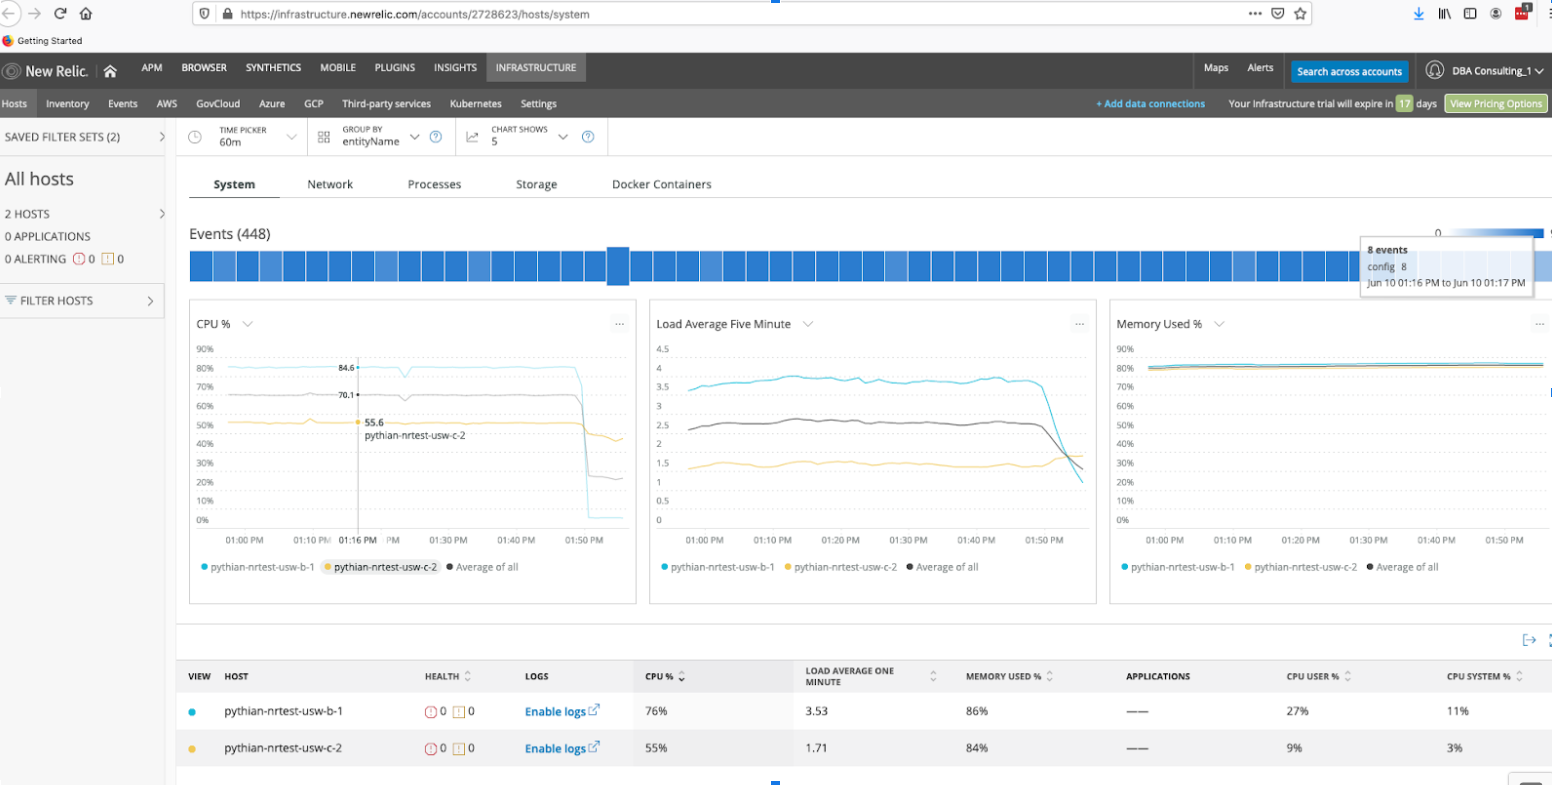
systemctl restart newrelic-infra.serviceNow that we have New Relic Infrastructure collecting data about our MySQL server(s) we can start creating custom graphs along with alert policies and notification actions. By signing in at https://login.newrelic.com/login we can see the MySQL hosts we added to New Relic Infrastructure.
Now we're ready to create alerts on any conditions / data New Relic collects. With the MySQL integration we have a large choice of metrics to choose from:
For our setup we are going to create a simple alert that will notify us whenever replication is stopped. In order to set up alerting, you need to create a new notification channel. To set up a notification channel, click on the alerts menu item. Next, pick the “Notifications channels” tab on the alerts page.
New Relic Alerts provides a nice selection of notification channels / integrations for alerting including Slack, PagerDuty, OpsGenie, XMatters and, of course, email. Once you have a notification channel set up, you can create a channel policy for receiving notifications:
Once you have a notification channel and policy defined you can start creating alert conditions:
Below you can see I picked the “Integrations” alert type to get the list of MySQL metrics. I then chose the “MySQLSample” and narrowed the scope to MySQL servers with the “cluster - node type” of slave. This will enable this alert on all New Relic hosts set up with the MySQL integration that are slave members using replication.
We define the measurement threshold for the metric. In this case it's always "1" when replication is running and "0" when it’s stopped. We also choose the alert policy / notification channel, then click “create.”
And we have created our first alert.
It's important to make sure you're targeting the proper servers for each alert. In our example above, for the “narrow down entities” option, we indirectly targeted only MySQL DB Servers by choosing a metric that only MySQL instances will send to our New Relic account. That’s great for this metric, but as the DBA (database administrator) we don’t want to get paged for anything other than the database hosts and database server issues. One way we can narrow down entities is via tags or other attributes. To ensure you are only monitoring the hosts you are targeting it's a best practice to use tags generously in your infrastructure deployment code and leverage them in “narrow down entities” for precise monitor targeting. For monitoring the “MySQL Server Down” condition, we'll use the general host level metrics and leverage the process information to alert only when we see a count of zero /usr/sbin/mysqld processes. With a few more clicks I have now added MySQL database server alerts for excessive CPU conditions, max_connections or MySQL Server failures:
Another way to explore these metrics is to use the Data Explorer which is part of “New Relic Insights” and can be found as a tab in New Relic Infrastructure. Data Explorer lets you list / graph individual metrics and build alerts if desired. Below you can see I was examining the metric “Avg Cluster.Seconds Behind Master”:
With Insights and its tools you can explore your data and create custom dashboards:
Hopefully this post has provided you with a helpful overview of the type of MySQL alerting and monitoring you can set up using New Relic Infrastructure.

