Introduction
In this blog post, I'm not going to talk about what the term SRE means or how it works. My understanding is that Google has invented the term "Site Reliability Engineer" and that this is Google's way of doing system administration. If you want to find out what the Google folks have to say on this topic, these videos are a good primer:
- Site Reliability Engineers — Keeping Google up and running 24/7 by Google Students
- What's the Difference Between DevOps and SRE? by Google Cloud Platform
I am going to share some valuable insights that System Admins and DevOps and SREs should keep top of mind.
Today, people are accessing websites, using credit cards, watching videos, etc. online. They usually have no idea what happens behind the scenes when they are doing it and they don't need to know.
TCP/IP stack
There are only a handful of people who really have a full view of this, and it is what they do every day. Thankfully the system works and the average person doesn't really need to worry. However, for those working behind the scenes to make this happen, it is important to be in the know.
I have found a very good image on the internet. Credits to https://www.cellbiol.com/bioinformatics_web_development
Application layer -> What we call services nowadays. Protocols that implements functions and behaviors.
Transport layer -> How data is going to be handled. Flow, control, window, confirmation, etc
Internet Layer -> This is the IP protocol implementation itself.
Network access -> If there's physical connection to communicate.
TCP/IP features
This is another awesome diagram that I've found. I'm not going to talk about every single feature of TCP/IP, but the most important are:
- Acknowledgment. The packets receiver must confirm that packet was received.
- Buffer. Auto manages buffer sizing by increasing and decreasing window size to have the best throughput in that connection.
- Urgency. Packets can have priority over another when required
So, it basically implements control which is the opposite of UDP. UDP only sends the packet to the network.
DNS architecture
Client side
One simple name resolution occurs in many steps. Several queries are performed for that first query be answered.
First of all, I'm going to keep tcpdump running and in another terminal, I'm going to perform a query for www.google.com.
Note that if I'm not specifying query type, by default it is type A.
$ dig @127.0.0.1 +short www.google.com 216.58.202.36Let's take a look at the tcpdump output.
# tcpdump -nn -vv port 5315:05:22.617148 IP (tos 0x0, ttl 255, id 12497, offset 0, flags [none], proto UDP (17), length 60)10.0.136.58.53531 > 10.0.0.2.53: [bad udp cksum 9190!] 54882+ A? www.google.com. (32)15:05:22.617502 IP (tos 0x0, ttl 255, id 44530, offset 0, flags [none], proto UDP (17), length 76)10.0.0.2.53 > 10.0.136.58.53531: [udp sum ok] 54882 q: A? www.google.com. 1/0/0 www.google.com. A 172.217.13.228 (48)
What just happened? 1.
- My local IP (10.0.136.58) sent A? www.google.com. to DNS Server in /etc/resolv.conf (10.0.0.2).
- The DNS Server responds that www.google.com. A record is 172.217.13.228. Note that the query as for www .google .com ., the last . is automatically included by the RFC specification, which makes sense (we are going to see why later).
Where are the several queries I talked about? Let's take a look at what happens in the server. I'm going to spin up a bind in another instance.
Server side
$ dig @10.0.139.80 +short www.google.com 172.217.15.68 Also, I had another session with tcpdump running. I will remove some lines from the output to make visualization easier.
77:30:44.582600 IP 10.0.136.58.38750 > 10.0.139.80.53: 41593+ A? www.google.com. (32) The client asks record A for www.google.com. to the DNS Server.
17:30:44.583193 IP 10.0.139.80.5755 > 192.5.5.241.53: 717% [1au] NS? . (28) DNS Server asks record NS for . to the Root Server.
17:30:44.584827 IP 192.5.5.241.53 > 10.0.139.80.5755: 717*- 14/0/27 NS m.root-servers.net., NS b.root-servers.net., NS c.root-servers.net., ... Root Server answers all nameservers for . (root domain).
17:30:44.596075 IP 10.0.139.80.40909 > 192.36.148.17.53: 3992% [1au] DS? com. (32)DNS Server asks NS for com. to one of the previous answers. In this case, 192.36.148.17 is i.root-servers.net. (one of the nameservers of .).
17:30:44.597935 IP 10.0.139.80.42331 > 192.12.94.30.53: 16963% [1au] DS? google.com. (39)
DNS Server asks NS for google.com. to one of the previous answers. In this case, 192.12.94.30 is a.gtld-servers.net. (one of the nameservers of com.).
17:30:44.586726 IP 10.0.139.80.39984 > 216.239.32.10.53: 22437% [1au] A? www.google.com. (43) DNS Server asks A for www.google.com. to one of the previous answers. In this case, 216.239.32.10 is ns1.google.com. (one of the nameservers of google.com).
17:30:44.595764 IP 216.239.32.10.53 > 10.0.139.80.39984: 22437*- 1/0/0 A 172.217.15.68 (48) The google.com's name server answers me the record A for www.google.com. which is 172.217.15.68.
17:30:45.475080 IP 10.0.139.80.53 > 10.0.136.58.38750: 41593 1/4/8 A 172.217.15.68 (296) The DNS Server answers back to the client the record A for www.google.com.
Traceroute
Have you ever asked how traceroute works? Let's find out. For this, I've installed Wireshark on my personal computer and started to capture expression "host 8.8.8.8". It's going to filter any packet which destination or source host is 8.8.8.8.
Now, I'm going to run traceroute:
 $ traceroute -n 8.8.8.8
traceroute to 8.8.8.8 (8.8.8.8), 64 hops max, 52 byte packets
1 192.168.1.1 1.473 ms 0.633 ms 0.616 ms
2 * * *
3 187.100.186.58 8.991 ms 6.976 ms
187.100.186.60 6.552 ms 4 187.100.194.6 7.198 ms
187.100.194.4 6.907 ms
187.100.194.6 7.312 ms
5 187.100.34.129 7.087 ms 7.499 ms 7.207 ms
6 209.85.172.178 8.106 ms 7.148 ms 6.631 ms
7 108.170.245.129 7.454 ms 6.940 ms 7.042 ms
8 216.239.56.49 7.709 ms
72.14.236.1 7.321 ms 6.892 ms
9 8.8.8.8 6.417 ms 7.106 ms 6.862 ms
Let's go over the output: 1 - As 8.8.8.8 is not my local network, the first hop is my default gateway.
Thiagos-Mac-mini:~ tnache$ netstat -nr | grep default default 192.168.1.1 UGSc 81 28 en0
2 - * * * Means that hop was not able to be identified.
3 to 9 - returns the IP for each device it went thru.
So, let's see in Wireshark what happened. 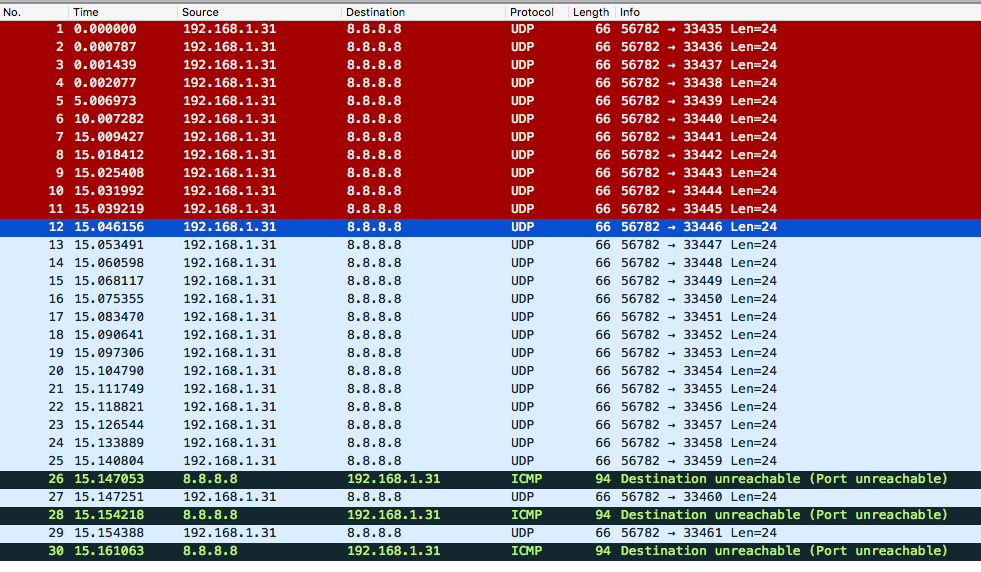 We can see several packets are sent back and forth. Let's examine the packets in detail (Please, revisit our image about the TCP/IP packet and pay attention to the IP headers).
As seen in the image above, you should note that traceroute uses UDP by default. So, why am I asking you to look into TCP/IP image? Because for us the important piece right now is the IP header. That being said, we can also say that traceroute works with ICMP.
Can you imagine now what happened? Let's open the first packet.
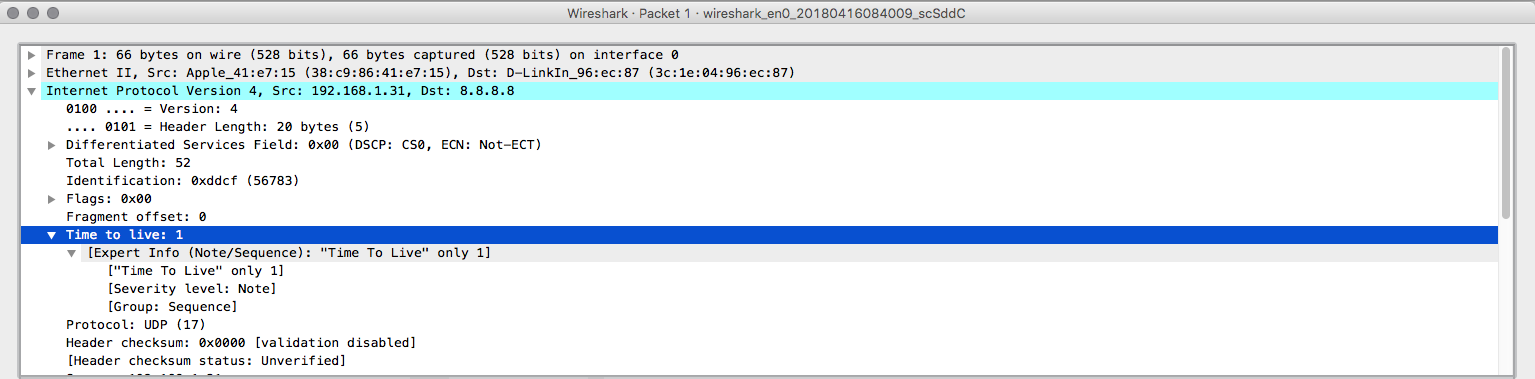
Everything looks like a normal packet unless you look into the TTL header. A packet with TTL=1 is going to reach an external host? No, so why traceroute is doing it? Let's open the packet number four now.
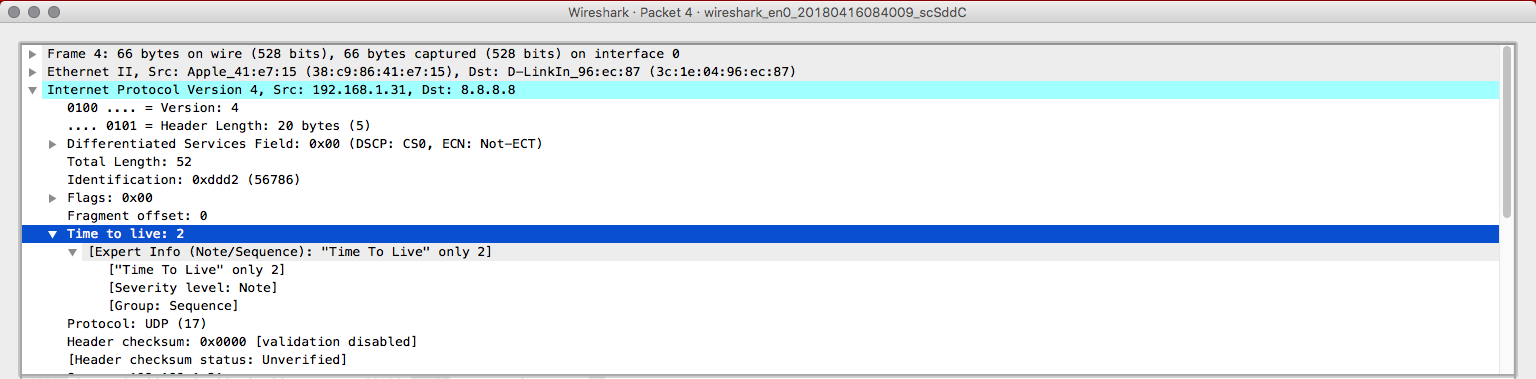
Okay, now the TTL is two. So, that's the logic. Traceroute will send packets from 1 until 30 or reach the destination by increasing one in the TTL header for every three packets (since there's no guarantee in UDP, only one packet could not be enough). The packet 7 will have TTL = 3, packet 10 = 4 and so on. When the packet dies, a response may be sent back or not, if the firewall rules allow the device to send the response back, traceroute will get the headers of that packet and determine the IP for that hop.
Conclusion
TCP/IP stack is a very stable stack and usually does not cause issues in the software layers (2,3 and 4), but there are several things happening and every engineer should keep an eye on it. Now that we've talked about TCP/IP and DNS I hope to write something about another layer 7 application or Linux internals.
"Class SRE implements DevOPS"
(Note: you will understand only if you watch the video I've posted earlier here.)

