Snowflake is one of the most popular cloud data platforms companies rely on for their data management needs. Usually, when users realize how easy it is to work with, the consumption of the platform increases dramatically. After all, who doesn’t want to analyze more data and get more and more insights? However, with great power comes great responsibility, and companies need to manage Snowflake resources and costs effectively to ensure they get the most out of their investment.
In this post, we’ll cover some strategies and best practices for managing the cost of your Snowflake resources so that you can optimize usage, reduce expenses, and ensure your organization gets the best value from Snowflake.
Selecting the right platform and region
Snowflake is available across all three major cloud providers (AWS, Azure, and GCP) and in many regions worldwide for each of them. One critical decision is to select the right platform and area for your Snowflake account.
Make sure the features you are interested in are available on your platform, compare the storage prices (they are different), and keep in mind where you will access Snowflake from, as Snowflake will pass through egress charges to you on your bill. This isn’t just an optimization for cost but also for better performance since you will have much lower latency between your consumers and your Snowflake data.
Monitor resource usage
One of the most critical steps in managing Snowflake costs is to monitor resource usage regularly. This will help you identify areas where you can optimize resource utilization and reduce costs.
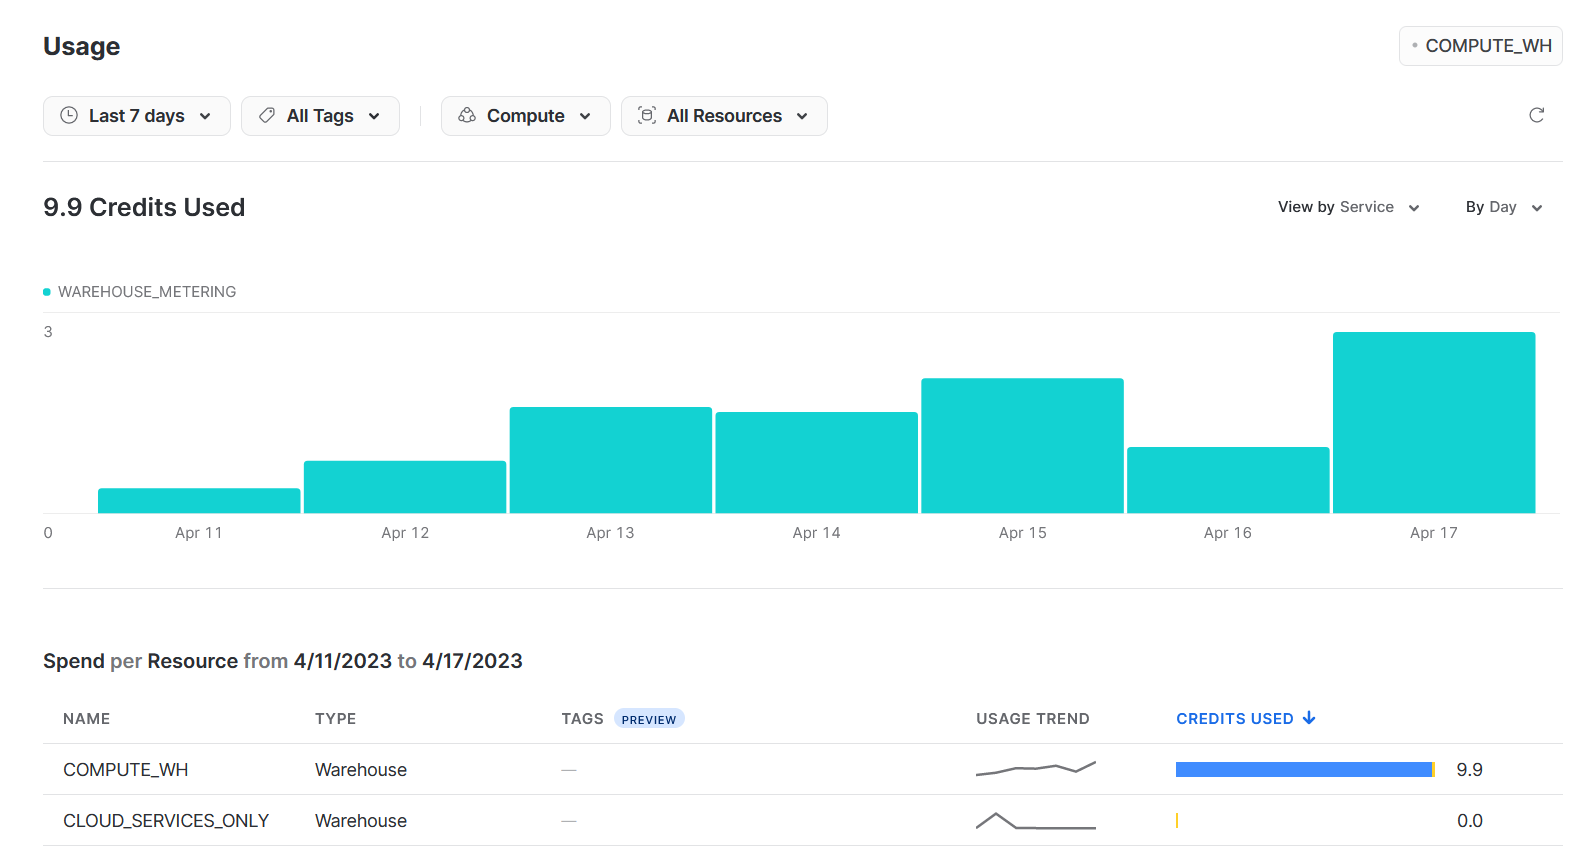
Snowflake provides an account usage dashboard that you can use to monitor usage across your organization. This dashboard provides detailed information on compute and storage usage, query activity, and other key metrics. You can use this information to identify areas where you can optimize resource utilization and reduce costs.
In addition, setting up cost alerts to prevent unexpected bills is crucial. You can set up alerts to notify you when you’re approaching a certain spending threshold, so you can take action to reduce usage or adjust resource allocation as needed.
Creating resource monitors to keep an eye on your virtual warehouse consumption is extremely simple. For example, this is a resource monitor that will notify a user called ‘consumptionAdmin’ when it reaches 75% of 1000 units, it will stop the warehouse but allow the queries to finish at 100%, or it will immediately shut it down at 110%:
create or replace resource monitor limiter with credit_quota=1000
  notify_users = (consumptionManager)
  triggers on 75 percent do notify
           on 100 percent do suspend
           on 110 percent do suspend_immediate
Optimize resource utilization
Another critical step in managing Snowflake costs is to optimize resource utilization. By identifying under and over-utilized resources and adjusting resource allocation based on usage patterns, you can reduce overall costs or at least the most power from your dollars.
Snowflake’s Query History view is an excellent first step for this. This view provides detailed information on computing activity across all warehouses to give you a global picture of activity.
With this information, you can adjust resource allocation based on usage patterns. For example, you can increase resource allocation during peak usage periods and decrease it during off-peak periods.
An excellent way to find ‘hot spots’ of usage is by mining the information in the Query History view. For example, the following query will aggregate compute consumption and data throughput for any given day:
SELECT
    DATE_TRUNC('day', END_TIME) as "Day",
    SUM(EXECUTION_TIME) / 1000 / 60 / 60 as "Compute Hours",
    SUM(BYTES_SCANNED) / 1024/1024/1024 as "Data Scanned (GB)"
FROM
    SNOWFLAKE.ACCOUNT_USAGE.QUERY_HISTORY
WHERE
    QUERY_TYPE = 'SELECT'
    AND END_TIME >= DATEADD('day', -7, CURRENT_TIMESTAMP())
GROUP BY
    "Day"
ORDER BY
    "Day" ASC;
You can use this example as a template and aggregate it down to hours, slice it by warehouse, user, and more.
If you want to see the warehouse usage in more detail, you can use the Warehouse Metering History view to see the usage by warehouse separated by direct compute consumption and cloud services (indirect consumption from managing the warehouse). Here is an example:
SELECT
    DATE_TRUNC('day', END_TIME) as "Day",
    WAREHOUSE_NAME,
    SUM(CREDITS_USED) as "Total Credits",
    SUM(CREDITS_USED_COMPUTE) as "Total Credits Compute",
    SUM(CREDITS_USED_CLOUD_SERVICES) as "Total Credits Cloud Services"
FROM
    SNOWFLAKE.ACCOUNT_USAGE.WAREHOUSE_METERING_HISTORY
WHERE
     END_TIME >= DATEADD('day', -7, CURRENT_TIMESTAMP())
GROUP BY
    "Day", WAREHOUSE_NAME
ORDER BY
    "Day" ASC;
Use storage wisely
Storage costs can significantly impact your overall Snowflake expenses, so it’s important to use storage wisely. Here are some tips for managing storage usage in Snowflake:
- Use data compression: Snowflake provides several compression options that can help you reduce storage usage and costs. For example, the GZIP compression algorithm can compress data stored in Snowflake’s internal or external cloud stages. For native table storage, you don’t have to worry about this as it is always columnar compressed.
- Use tiered storage: through the use of External Tables, Snowflake provides the option of doing tiered storage. You could store less frequently accessed data in lower-cost storage tiers by leaving it in cloud storage like S3, ADLS, or GCS buckets. This can help you reduce storage costs while still keeping data accessible. The most accessed, hottest data would still be native Snowflake tables.
- Delete unused data: It’s important to regularly delete unused data to free up storage space and reduce costs. We are always thinking about table storage, but one of the biggest silent consumers is the internal stages since users can import and export all sorts of files from there.
Using the Table Storage Metric view, you can find the tables that consume the most storage, including their Time-travel and Failsafe consumption. Watch out for large consumption of Time-travel and Failsafe, that’s a sign of too much data churn, and most likely, the storage settings for that particular table could be tuned.
SELECT
    TABLE_CATALOG,
    TABLE_SCHEMA,
    TABLE_NAME,
    ACTIVE_BYTES / 1024 / 1024 / 1024 as "Active Bytes (GB)",
    TIME_TRAVEL_BYTES / 1024 / 1024 / 1024 as "Time-travel Bytes (GB)",
    FAILSAFE_BYTES / 1024 / 1024 / 1024 as "Failsafe Bytes (GB)",
    (ACTIVE_BYTES + TIME_TRAVEL_BYTES + FAILSAFE_BYTES)  / 1024 / 1024 / 1024  as "Total Bytes (GB)"
FROM
    SNOWFLAKE.ACCOUNT_USAGE.TABLE_STORAGE_METRICS
WHERE
    FAILSAFE_BYTES > 0 OR TIME_TRAVEL_BYTES > 0 OR ACTIVE_BYTES > 0
ORDER BY
    "Total Bytes (GB)" DESC;
Use compute resources efficiently
Compute resources can also have a significant impact on your Snowflake expenses. Here are some tips for using computing resources efficiently:
- Use the right size of compute resources: Snowflake provides several compute sizes to choose from, and it’s important to use the right size of compute resources for your specific workloads. Using more considerable computing resources than necessary can result in unnecessary costs. The “query acceleration” feature can save you money by only pumping resources into the queries that need it. This feature is only on the Enterprise edition or higher.
- Use Snowflake’s auto-suspend feature: Snowflake provides an auto-suspend feature that allows you to automatically stop unused compute resources after a specified period. This can help you reduce costs by only using computing resources when needed.
- Use concurrency scaling: Snowflake provides a concurrency scaling feature that allows you to automatically add or remove clusters based on demand. You can always start with just 1, let the service expand, and contract based on workload requests.
Set up cost-effective data pipelines
Finally, data pipeline design can also impact Snowflake costs. Here are some tips for setting up cost-effective data pipelines:
- Use incremental loading: Instead of loading all your data every time, use incremental loading to only load new or changed data. This can help reduce load times and the cost of processing unnecessary data. Snowpipe is perfect for this.
- Avoid small micro-batches: batch rows together to hit at least 50MB files or more for loading if possible. Specifically, when working with Snowpipe, you don’t want to burn compute by loading small files frequently instead of a bigger file every few minutes.
- Use Snowflake’s features for managing data pipelines: Snowflake provides several features to help you manage data pipelines more efficiently. For example, you can use tasks and streams to automate data processing and reduce polling or manual effort.
You can find the most actively loaded tables using the Copy History view. Once you have identified a few tables with a lot of activity, you can look in detail to see if their loading patterns can be optimized through compression, larger batches, etc.
SELECT
    DATE_TRUNC('day', LAST_LOAD_TIME) as "Day",
    TABLE_CATALOG_NAME,
    TABLE_SCHEMA_NAME,
    TABLE_NAME,
    SUM(ROW_COUNT) as "Row Count",
    SUM(FILE_SIZE) /1024 / 1024 as "File Size (MB)",
    SUM(ERROR_COUNT) as "Error Count"
FROM
    SNOWFLAKE.ACCOUNT_USAGE.COPY_HISTORY
GROUP BY
"Day", TABLE_CATALOG_NAME, TABLE_SCHEMA_NAME, TABLE_NAME
ORDER BY
    "File Size (MB)" DESC;
Conclusion
Managing Snowflake costs is an ongoing process that requires regular monitoring and optimization. By following these strategies and testing them out with your account, you will understand your current state better and can craft an effective plan for cost optimization.
We hope these tips will help you manage your Snowflake costs more effectively. Do you have any other tips or best practices to share? Let us know in the comments!