This is the second in a series of blog posts covering the most important topics you should know to completely monitor your IT infrastructure with Oracle Enterprise Manager Cloud Control 13c. In the previous post, Part 1, we covered how to set up basic monitoring.
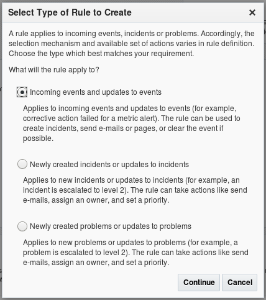
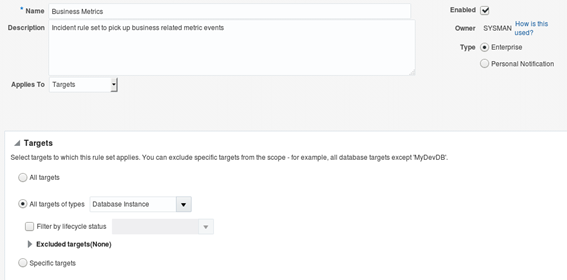 Chose the desired option:
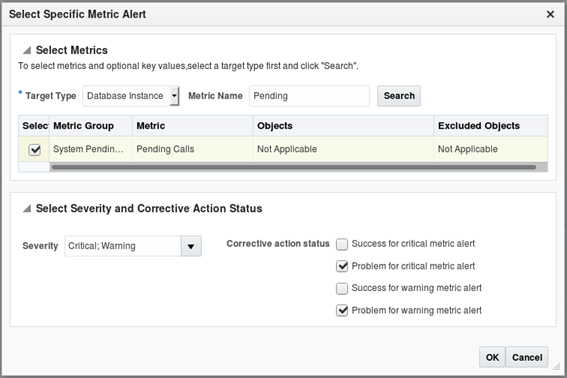
 To keep a clean and easy to maintain setup, I deem it easier to individually select each metric to be handled by each rule so it's easier to identify which metric is treated by each rule, and keep a generic rule at the bottom of the rule set processing line to pick up all missed events and notify by e-mail so such events can be reviewed and added to one of the other rules, if required. This kind of configuration allied with the proper metrics and threshold settings at the target level will make it easier to maintain a healthy and adjustable OEM environment. Select the severity(ies) to which OEM should send notifications, as well as notifications about corrective actions that might be related to the metric (corrective actions will be covered later on this series).
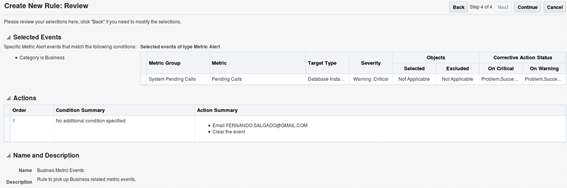
 After setting all the details, this is what the new rule looks like:
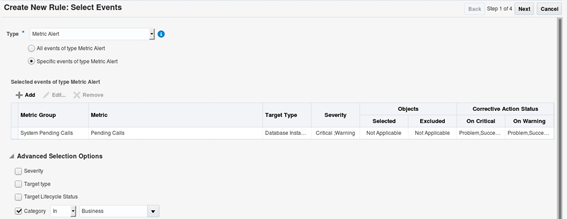 Select whether the event should be cleared after being processed by checking the “Clear permanently” box. This prevents the same event from being picked up by another rule down the line.
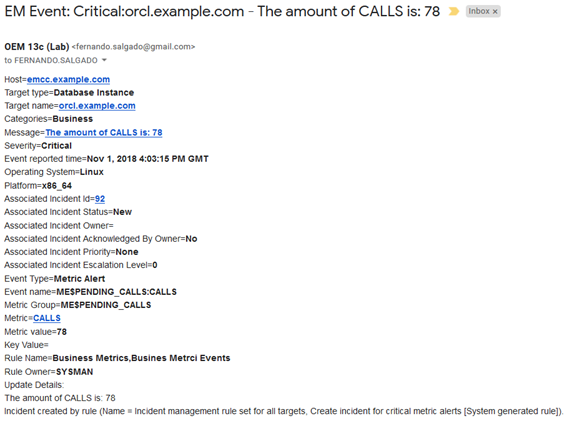 This e-mail identifies the metric that generated the alert “ME$PENDING_CALLS” (All extended metrics are preceded by “ME$”), as well as the incident rule that handled the event: “Business Metrics, Business Metrics Events”. This information helps while troubleshooting issues with metrics / incident rules. The message displayed can be specified during the metric creation. It may be altered to use the built-in variables to get the actual values. All details on extended metrics variables are displayed during the metric creation. It’s recommended to review these details. Extended metrics can be used to monitor virtually anything, either on a DB or outside of it, given the possibility of including personalized server-side scripts into OEM regular monitoring, which can run from simple HTTP checks to monitor website availability to complex shell scripts running any number of checks and returning a status message that can be compared against regular expressions to determine whether an alert should be raised. Depending on the metric settings, historical data collection can be kept in the OEM repository for reporting purposes. Such reports can be created and automated directly thru OEM by using the “Information Publisher Reports” and the “MGMT” views existing inside the OEM repository database.
Stay tuned for the next blog post which will cover how to create reports based on historical / current metric data.
This e-mail identifies the metric that generated the alert “ME$PENDING_CALLS” (All extended metrics are preceded by “ME$”), as well as the incident rule that handled the event: “Business Metrics, Business Metrics Events”. This information helps while troubleshooting issues with metrics / incident rules. The message displayed can be specified during the metric creation. It may be altered to use the built-in variables to get the actual values. All details on extended metrics variables are displayed during the metric creation. It’s recommended to review these details. Extended metrics can be used to monitor virtually anything, either on a DB or outside of it, given the possibility of including personalized server-side scripts into OEM regular monitoring, which can run from simple HTTP checks to monitor website availability to complex shell scripts running any number of checks and returning a status message that can be compared against regular expressions to determine whether an alert should be raised. Depending on the metric settings, historical data collection can be kept in the OEM repository for reporting purposes. Such reports can be created and automated directly thru OEM by using the “Information Publisher Reports” and the “MGMT” views existing inside the OEM repository database.
Stay tuned for the next blog post which will cover how to create reports based on historical / current metric data.
Extended Metrics
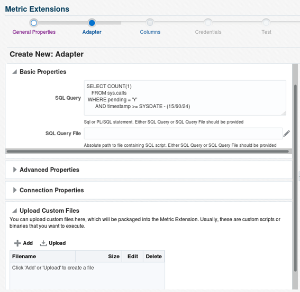
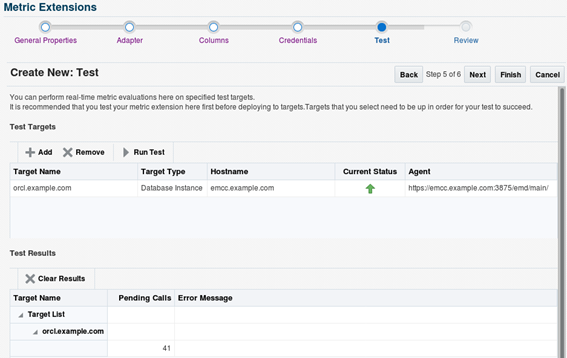
As mentioned in the previous post, Oracle Enterprise Manager (OEM) monitoring capabilities are significantly extended with the use of Extended Metrics, which allows the administrator to create any number of metrics based on SQL. PL/SQL, shell scripts, and so on. It allows administrators to, for example, check the availability of a web site using simple Linux commands such as curl, or monitor business-related information such as non-authorized transactions or calls received per minute, based on database queries or PL/SQL blocks. These personalized scripts are integrated into OEM which will execute it at a defined interval and can raise alerts just like any other metrics, based on the specified thresholds. Saving historical data of such metrics will also allow the development of automated reports for analyzing trends and assisting with business decisions. This section shows how to create an extended metric and use its data as a basis for an automated report, showing how many "Pending Calls", exist on the system. Note: To simulate some business-related issues, I've created a simple "CALLS" table, which has an ID, a timestamp, a caller name, and a pending flag that could be either "Y" or "N". The metric will check the number of calls with "PENDING"='Y' existing on the table for the past 15 minutes and if the number is higher than the available threshold, it will trigger an alert. The structure of the table, and other objects used to populate it, are in the "Appendix A" To create a new metric, go to: Enterprise -> Monitoring -> Metric Extensions. Click the “Create” button and select “Metric extension”. In this scenario, the database side metric extension being created will collect pending calls from a transaction table, so select the options as presented below.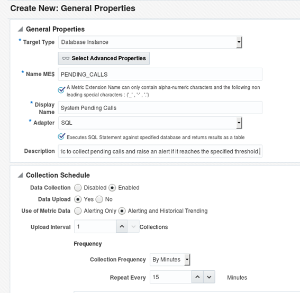
A column is either a Key column, or Data column. A Key column uniquely identifies a row in the table. For example, employee ID is a unique identifier of a table of employees. A Data column is any non-unique data in a row.
Value Type:A value type is Number or String. This determines the alert comparison operators that are available, and how Enterprise Manager renders collection data for this metric column.
Note that the column order should match the order with which the adapter (SQL Query, OS script, etc.) returns the data. Below is an example of a data column settings: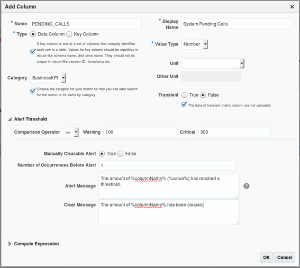
Chose the desired option:
To keep a clean and easy to maintain setup, I deem it easier to individually select each metric to be handled by each rule so it's easier to identify which metric is treated by each rule, and keep a generic rule at the bottom of the rule set processing line to pick up all missed events and notify by e-mail so such events can be reviewed and added to one of the other rules, if required. This kind of configuration allied with the proper metrics and threshold settings at the target level will make it easier to maintain a healthy and adjustable OEM environment. Select the severity(ies) to which OEM should send notifications, as well as notifications about corrective actions that might be related to the metric (corrective actions will be covered later on this series).
After setting all the details, this is what the new rule looks like:
Select whether the event should be cleared after being processed by checking the “Clear permanently” box. This prevents the same event from being picked up by another rule down the line.